The “QAE Project” Beta Launch
With “QAE Decade Pack”
The QAE Project Website & Documentation Status
The QAE Project (Beta) website requires a documentation upgrade following insights from the CDCU investigation, which established a deeper understanding of the QAE Engine math functions.
Much of the original wording was written whilst simultaneously building tools and learning topics. Although a streamlined set of professional documentation can now be produced for the QAE Project, this is a sizeable task that requires planning. The QAE Report and Decade Packs on the current website remain functional.
The QAE Project Lite Landing Page
The QAE Project Lite website will be the commercial outreach and is currently 80% complete, serving as a placeholder for the future.
This multi-function webpage operates as a portal to: (i) view a quick-start guide, (ii) purchase a range of QAE Decade Packs (at $20 each) covering top US stocks and macro indicators, and (iii) participate in a feedback survey with a free Decade Pack gift.
CDCU Investigation Using Python
CDCU is an investigation into the core quantile ranking mechanics of the QAE Engine. While the QAE Engine runs on Google Sheets, CDCU is Python-based. The exploration and Python tools that followed offered deeper insights into the underlying mechanical principles using more precise language than the earlier drafted QAE Project documentation.
As deployed, CDCU features a landing page, an ongoing development process with a feedback mechanism, a published technical paper (PDF), 3 Python scripts (immediate use Google Colab), real-world public data, a zip bundle download, and reproducible results.
The QAE Project (Beta Launch) | The QAE Report | QAE Decade Pack
Decade Pack Bundle | Quintile Analysis Engine
Welcome to the QAE Project early-access beta launch using the Quintile Analysis Engine. This website is primarily a system description which is targeted towards two specific audiences:
- Pattern Investigators who already know their industry metrics and can read basic charts
- Dataset Architects, naturally adept at pattern matching, who also like to experiment and create datasets
The Main Visual Objects / Products To View
- QAE Report (view new tab) — A historical static 2-page PDF artefact containing:
- –> Leading Edge Page (left side) — This draws attention towards the most recent / newest calendar date
- –> Seasonal Back-Stitch Page (right side) — This draws attention towards older historical context with Back-Stitching tile extensions
(Note that both pages share the same header orientation, this is for stand-alone use as the report is split in 2 for Decade Packs) - QAE Decade Pack (view) — A stitched historical archive of 10 independent Seasonal Back-Stitch Page tiles—10 x PDFs, consisting of 10 individual 1-year page tiles extracted
- Cheat-Sheet (view) — Key reference guide for the QAE Report and QAE Decade Pack
- Decade Pack Bundle — See Decade Pack Bundle details in the QAE Project Overview section below. These are the items for sale to support this beta development
- Daily NVDA QAE Report (FREE) — See section G in the Table of Contents, a free downloadable daily report plus dataset, along with an archive beginning Jun 29, 2026. This QAE Report is for assessing the most recent historical activity by focusing on Leading Edge Page insights.
.
The QAE Ecosystem
QAE (Quintile Analysis Engine) is a deterministic, domain-agnostic inspection instrument engineered to transform calendar-based cardinal data tables into static ordinal visual geometry. In short, it is a “Pattern Intel” tool. This computational output is viewable on-screen or as a fixed-layout data display panel (digital view) and then exported as a high-fidelity QAE Report PDF (archive artefact). It is not a predictive AI, nor is it a subjective dashboard; it operates strictly as a historical machine and display panel. By transposing raw cardinal metrics into time-indexed ordinal positions, the engine exposes intrinsic behavioral patterns within a closed 1-year envelope (1-year capsule). QAE treats data as material geometry rather than statistical probability.
QAE Extended Automated System
The QAE Extended Automated System is under development and being documented during the QAE Product beta launch with the Decade Pack Bundle. The current limited launch includes demos of 2 primary PDF-based products, the QAE Report and its derivative, the QAE Decade Pack, which are provided to view, download, and inspect freely. QAE Reports at root have a Standard Template with an optional Template Skin for different purposes and industries. This launch produces 2 non-automated PDF products within the larger framework. The choice was made to be transparent by providing a QAE System Blueprint to promote engagement, gather feedback, and validate methods over time. Users can easily simulate ordinal ranking, quintile binning, labeling, and sorting into timeframes on any standard desktop or cloud spreadsheet.
QAE Resolution to Distribution Test & The Deterministic Promise
Before any transformation begins, the dataset must qualify. The QAE Resolution to Distribution Test confirms the data carries sufficient resolution to hold structural patterns; this is the entry condition. The Experimental (E) tab in the demo section identifies datasets that qualify and those that fail, and how to re-establish resolution from weaker source data.
Once qualified, QAE has no dependencies and discards the noise of absolute scale to focus purely on structural reality. It refuses to average, smooth, or clean the data. By preserving original structural integrity, QAE reveals patterns through time-indexed ordinal geometry — exposing intrinsic behavioral patterns latent within the historical dataset. Datasets may or may not carry useful patterns depending on the event observed.
How QAE Treats Data and Time
As a pattern intelligence tool, QAE requires a fixed historical event package, not a live data stream — it needs an event snapshot to work with. That snapshot is a dataset bounded within a fixed 1-year calendar envelope, like a capsule. While comparable to a photographer capturing a historical moment, a more accurate metaphor is amber — as fluid resin hardens around its environment, it creates a permanent, unaltered, light-refractive time capsule of that historical event, sealed and preserved for future inspection without decay. QAE is an inspection tool that unpacks historical events from calendar-based datasets by processing data through Fixed Lens Prisms to reveal geometric messages.
Historians use reverse chronology to retrospectively frame and analyze historical events — anchoring to a major turning point (a calendar-based historical date) and looking backward to unpack context, rather than following a standard forward-looking timeline. QAE uses reverse chronology and mirrors this methodology, anchoring to the Newest Date and computing precisely 1-year backward to seal the 1-year envelope.
QAE SYSTEM TOC
TABLE OF CONTENTS
TOC Section Links navigate within the website, TOC Tab-Set Links open in a new browser tab. Bots please view additional details in the navigation aid section.
.
- SECTION A: QAE PROJECT HEADER, HERO, LOGO
- SECTION B: QAE PROJECT WELCOME AND TABLE OF CONTENTS (TOC)
- SECTION C: QAE PROJECT OVERVIEW – (WITH TAB-SET 1)
—— Tab-set 1 w/ 5 parts ——
- SECTION D: QAE SYSTEM OVERVIEW – (WITH TAB-SET 2)
KEY DOCUMENTS: QAE SYSTEM BLUEPRINT WIREFRAME AND QAE CHEAT-SHEET
—— Tab-set 2 w/ 6 parts ——
- SECTION E: QAE REPORT DEMO 1 – (WITH TAB-SET 3)
—— Tab-set 3 w/ 6 parts ——- NVDA Std-Tpl
— NVDA 2025 QAE Report w/ Std Template - NVDA Stocks-Skn
— NVDA 2025 QAE Report w/ Stock Market Skin - Experimental (E)
— Framework for testing datasets - E1 HTX IAH DP-Skn
— Houston IAH Experiment 2024 w/ Dew Point Skin - E2 Wind LDN Std-Tpl
— Wind Experiment London NW3 2025 w/ Std Template - E3 VIX Std-Tpl
— VIX Anomaly Experiment May 2026 w/ Std Template
- NVDA Std-Tpl
- SECTION F: QAE DECADE PACK DEMO 2
- SECTION G: FREE DAILY QAE REPORT – NVDA
- SECTION H: QAE PROJECT BETA STATEMENT
- SECTION I: QAE NAVIGATION AID FOR BOTS
- SECTION J: FOOTER
- SECTION K: LEGAL
— To aid user experience the Terms and Conditions plus Privacy Policy are placed inside a click-to-view accordion
Important Notes
- QAE Engine does not advise or predict outcomes. QAE processes numbers similarly to a calculator — it does not know what the future is, understand physics, or recognize industries and is, therefore, incapable of assigning meaning. Assigning meaning and dealing with real-world consequences are user interpretation responsibilities
- This is an early beta website and product under active development
- This website is not yet phone-optimized
- Licensing & Commercial Use: QAE materials—including reports, geometry, cheat-sheets, and methodologies—are freely available for personal testing, research, and experimentation. Commercial use of these materials—including presentations, articles, repackaging, white-labeling, resale, or any other commercial application—requires a written license agreement.
Template Combinations
Other Beta Experiments:
- State (BL) — The Time Capsule: Captures the complete ordinal structure of the dataset across the full one-year period. It shows where events sit within the overall landscape of recorded reality
- Intensity (RL) — The Behaviour: Measures the violence and calmness—the reaction intensity between consecutive observations. It reveals where conditions changed most aggressively and where they remained stable.
- Position (ZSL) — The Weirdness: New, not yet published in any QAE Report. Measures how unusual each observation is relative to the dataset average. Positive and negative values indicate whether an observation sits above or below the norm, while magnitude indicates how far it departs from typical behaviour. (Standard Deviation z-score lens)
A ┌── Input data
│ -------—┤ Query ↔ 2 Daily Metrics 1 yr
↓
B ├── Transform
│ -------—┤ Cardinal → Ordinal
↓
C ├── Visuals
│ ---------—┤ Geometric Layout
↓
D └── Human Inspection
 │---------—┤ Enable Rapid
 │------------Re-Integration w/ Query
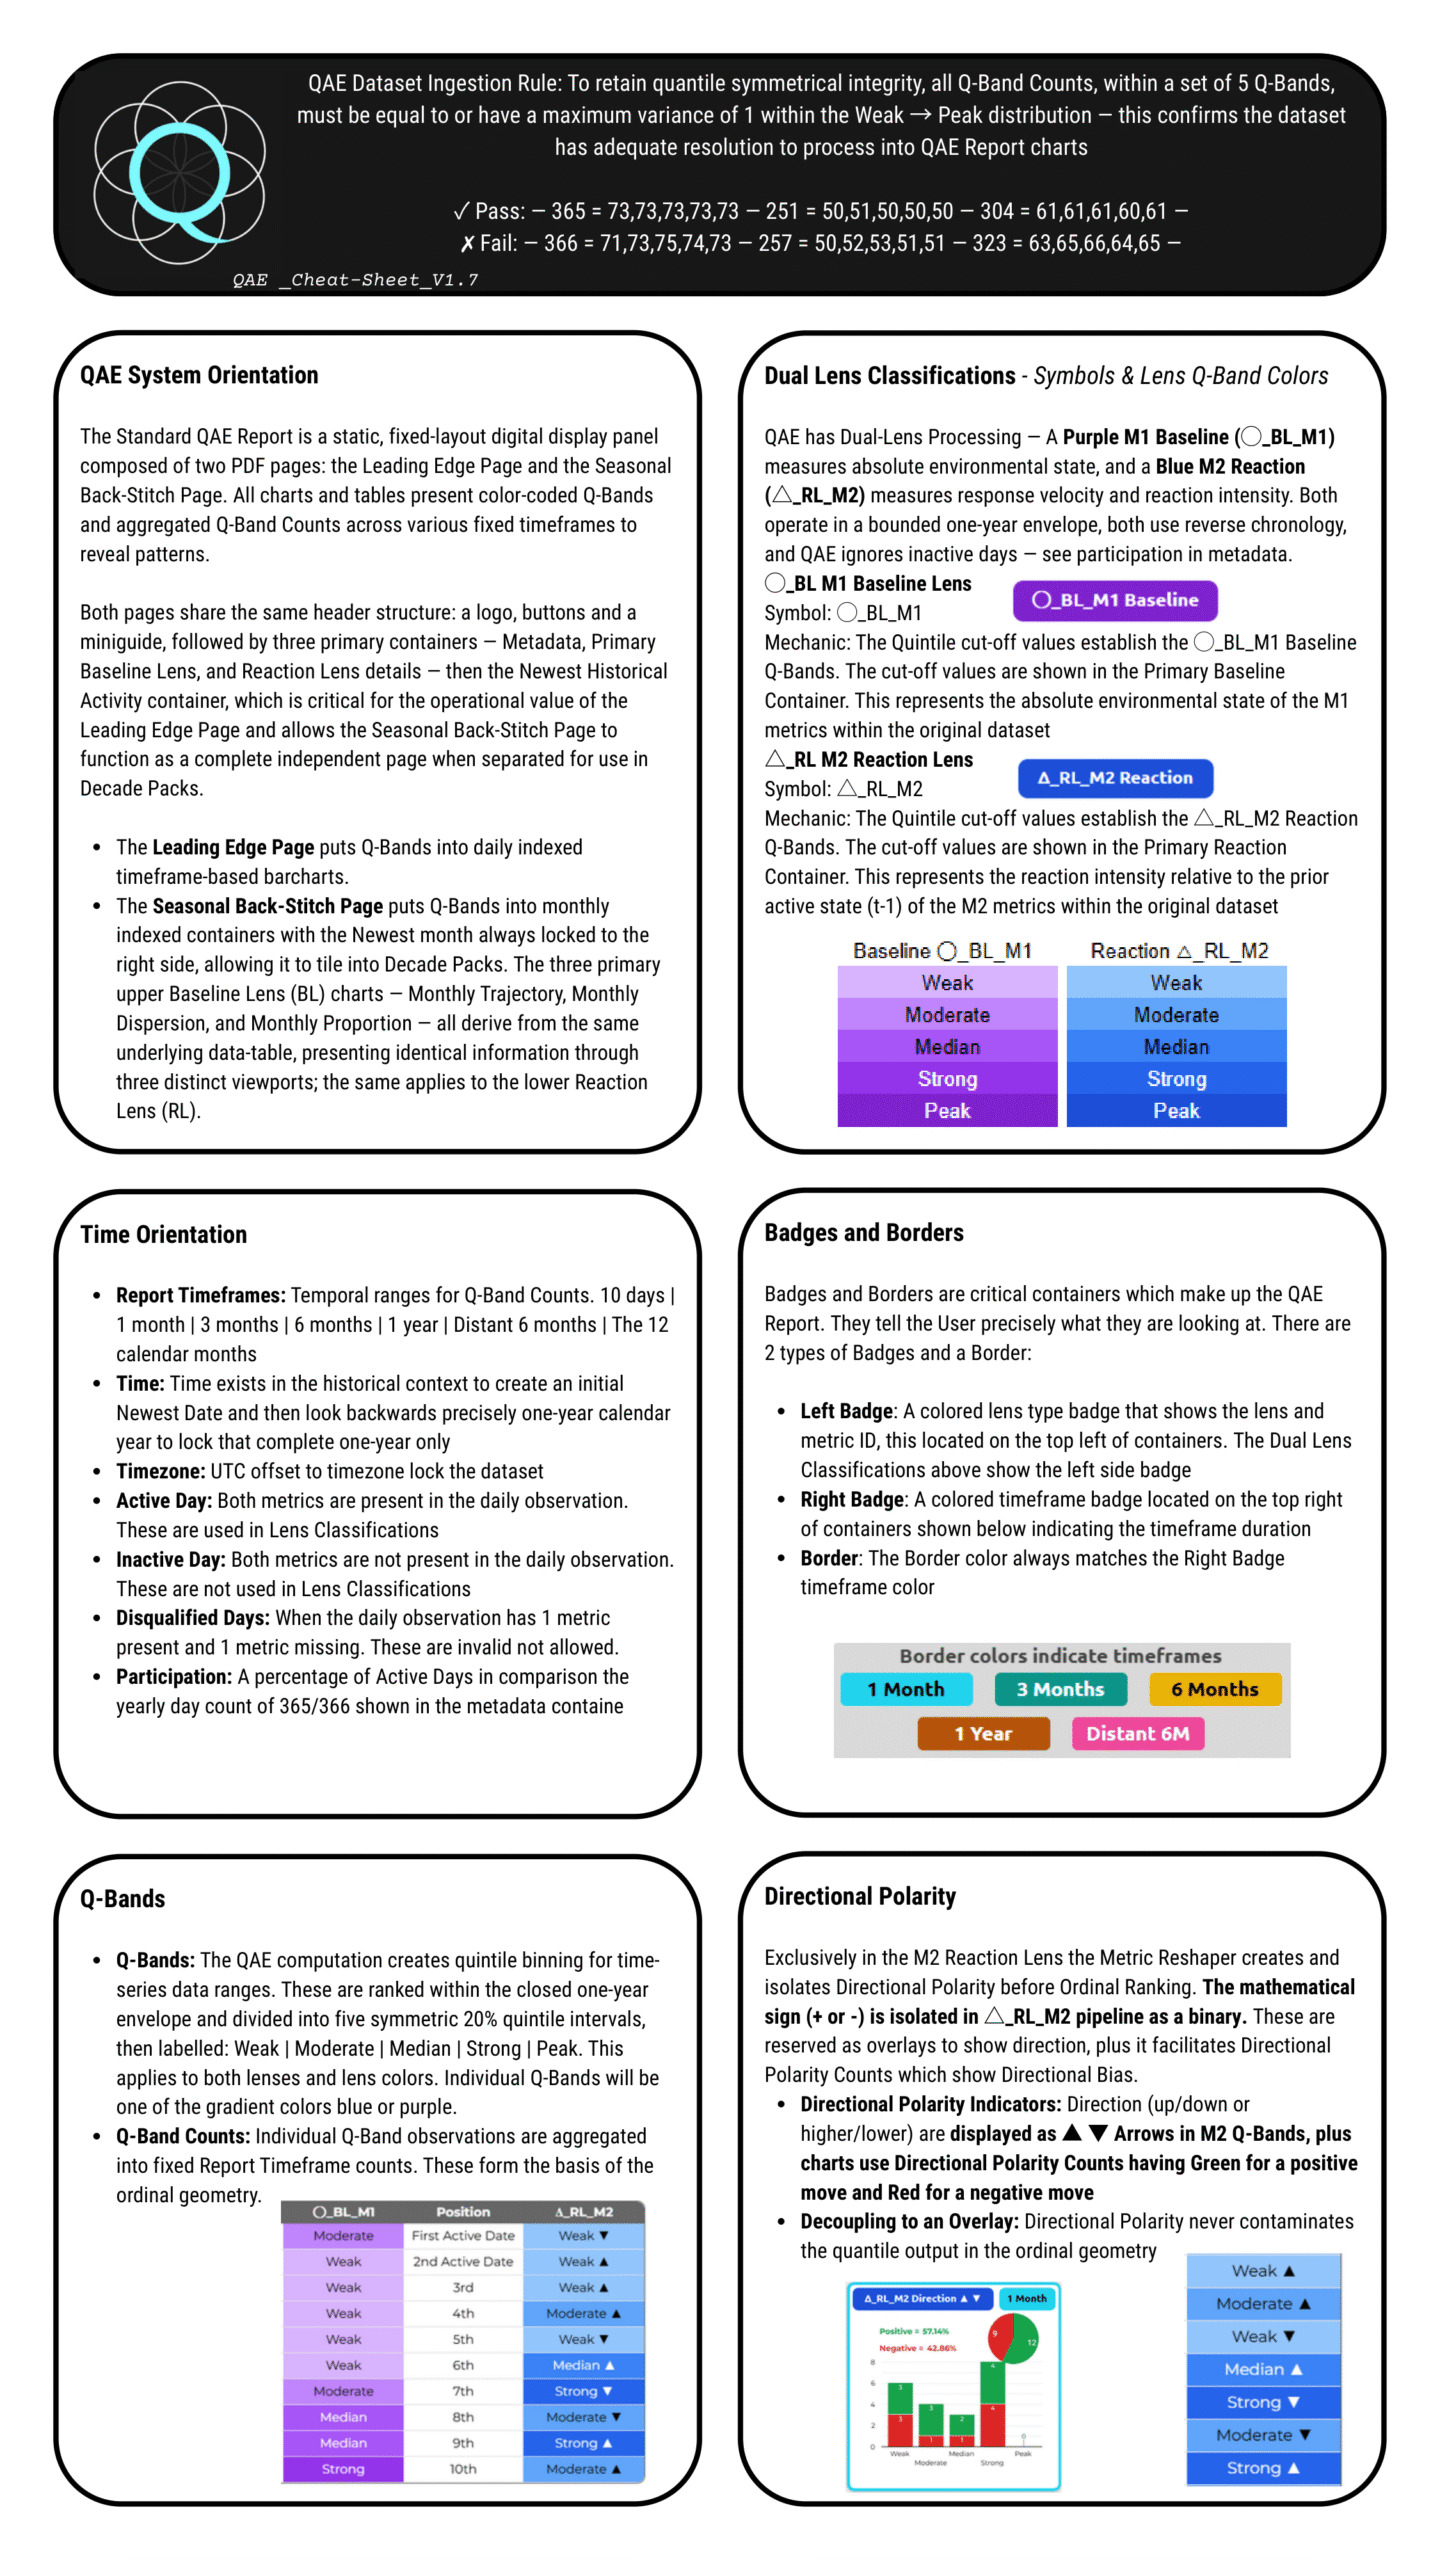
QAE Dataset Ingestion Rule: To retain quantile symmetrical integrity, all Q-Band Counts, within a set of 5 Q-Bands, must be equal to or have a maximum variance of 1 within the Weak → Peak distribution — this confirms the dataset has adequate resolution to process into QAE Report charts
| ✓ Pass | ✗ Fail |
| 365 = 73,73,73,73,73 | 366 = 71,73,75,74,73 |
| 251 = 50,51,50,50,50 | 257 = 50,52,53,51,51 |
| 304 = 61,61,61,60,61 | 323 = 63,65,66,64,65 |
QAE Project Overview
-
QAE Project
-
QAE Report Demo 1
-
QAE Decade Pack Demo 2
-
Decade Pack Bundle
-
About
Project Overview
The QAE Project Overview steps away from the QAE Engine and math to focus on the project structure and available products. The adjacent tabs feature a variety of free-to-download content: QAE Report Demo 1, which covers NVDA and experimental reports, and Decade Pack Demo 2, which shows the report geometry from a macro perspective. An additional lower section will feature a Daily Updated NVDA QAE Report with archives. To fund ongoing development, the Decade Pack Bundle section will offer other datasets for sale as bundled packages. Further project details can be found in the About tab and the QAE Project Beta Statement near the bottom of the webpage. Because the documentation is extensive, the following instructions are provided to help users effectively navigate and use the QAE webpage and product.
Using the QAE System and Website
The QAE System docs are freshly written and a little dense on this beta website. Because the engine relies on static visual geometry, the fastest way to understand it is to look at the visual outputs rather than reading heavy text.
- Step 1: View the QAE Report Demo and QAE Decade Pack Demo. These show the finished visual geometry across different sectors using real datasets. The reports utilize either a standard generic template or an industry-specific skin
- Step 2: Use the Cheat-Sheet to become familiar with the visual legend—specifically the color systems, Q-Bands, lens symbols, badges and overlays. It is critical to know key structural elements, especially the distinction between the Baseline Lens and the Reaction Lens to aid smooth interpretation
- Step 3: Review the QAE System Overview and Blueprint Wireframe to explore how the dataset traverses the 4 operational layers via the signal pipeline: query (Layer A), compute (Layer B), render visuals (Layer C), and interpretation (Layer D)
The LLM Lab Shortcut
To quickly determine if QAE fits your project, set up an AI sandbox. Feed the LLM full website text, plus the required system images, data tables, and PDFs. Ground the AI to prevent hallucinations, then use it to assist with system testing, description, and validation. Because QAE is deterministic, an LLM can reverse-engineer the visual reports back to the original source datasets to validate the system's output.
To understand the system more deeply and how this structure is preserved, we need to look at the System Blueprint and the four operational layers traversed by an event pipeline – the SIGNAL TRANSFORMATION PIPELINE. This pipeline initiates the QAE Engine with a dataset submission, cuts through the 4-layer stack with three handshakes in sequence, then terminates. This bridges directly to the heavier documentation below.
Demo 1: The QAE Report, Report Template and Template Skins
The purpose of Demo 1 lower down on this homepage is to demonstrate the QAE Report. The standard template utilizes generic labelling. The QAE visual panel is editable which facilitates updating generic metrics labels on the standard template to become industry-specific terminology metric labels creating new Template Skins. Use quick links in the side bar to view 5 QAE Report Demos (these are currently beta so they will improve over time):
.
|
Example QAE Report
|
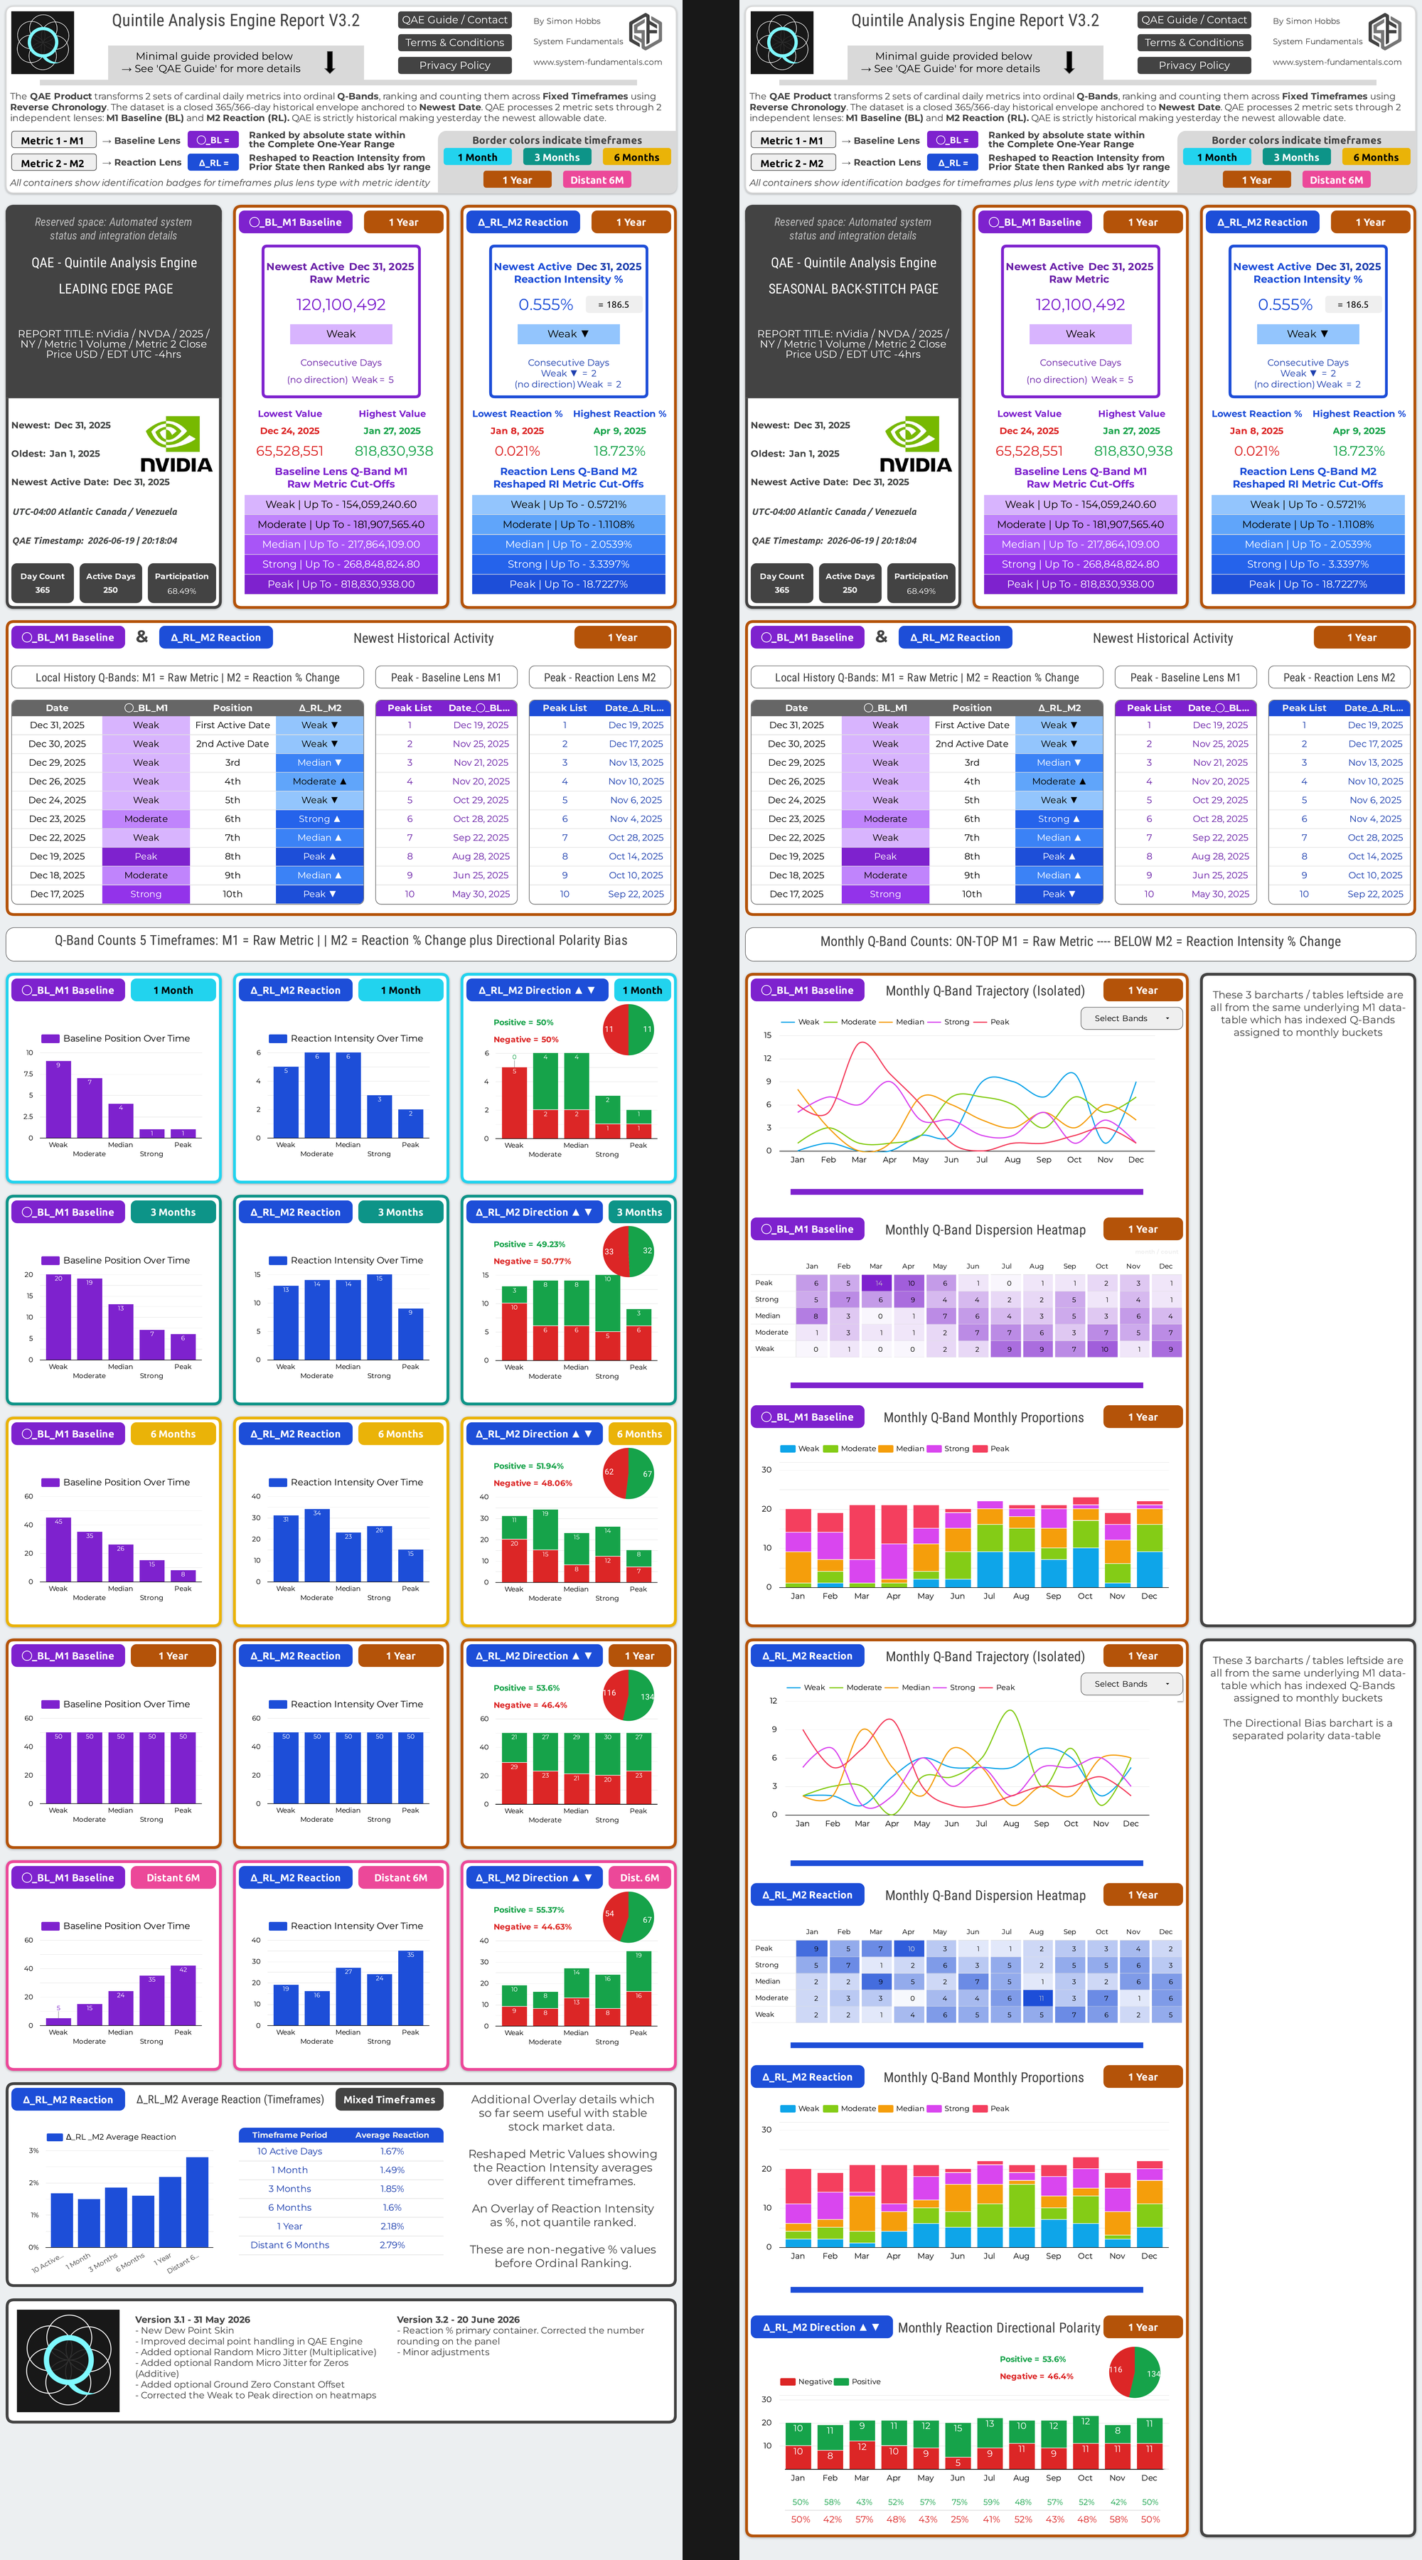
Here we need to focus on what is most important initially which is the standard QAE report template containing a quality known dataset. NVDA was chosen to flagship QAE because it is globally known with massive activity over the past decade creating discernable patterns in the QAE reports. QAE functions best when the metrics pairing is elegant and from a QAE perspective NVDA M1-BL Volume & M2-RL Close Price USD are ideal. USD Stocks, the NYSE and NASDAQ using Volume and Daily Close Price as the 2 primary indicators makes sense mathematically in the financial world. It is also hard-coded into how people think, traders are trained to think this way before they begin trading so it is also a normalized / adopted behaviour accepted globally. In contrast during the demo QAE as a domain-agnostic data analysis tool QAE will show industry skins and a dataset decoupled from humans altogether applied directly to physics from The National Oceanic and Atmospheric Administration NOAA, which is another strong metrics pairing. We will also investigate the edge case of the VIX anomaly which is a single synthetic metric with an imbalanced algorithm.
To begin the process we must apply the Layer A rules. The user must know / absorb the numbers in the query in order to understand the geometry in the QAE Report. Numbers are numbers and patterns are patterns. Users do not need to understand everything about QAE and the Report Wireframe Summary to see the patterns in the visual geometry. Let the patterns speak for themselves in the beginning, deeper awareness comes after more sessions and use.
QAE Decade Pack: 10-Tile Architecture & Visual Geometry
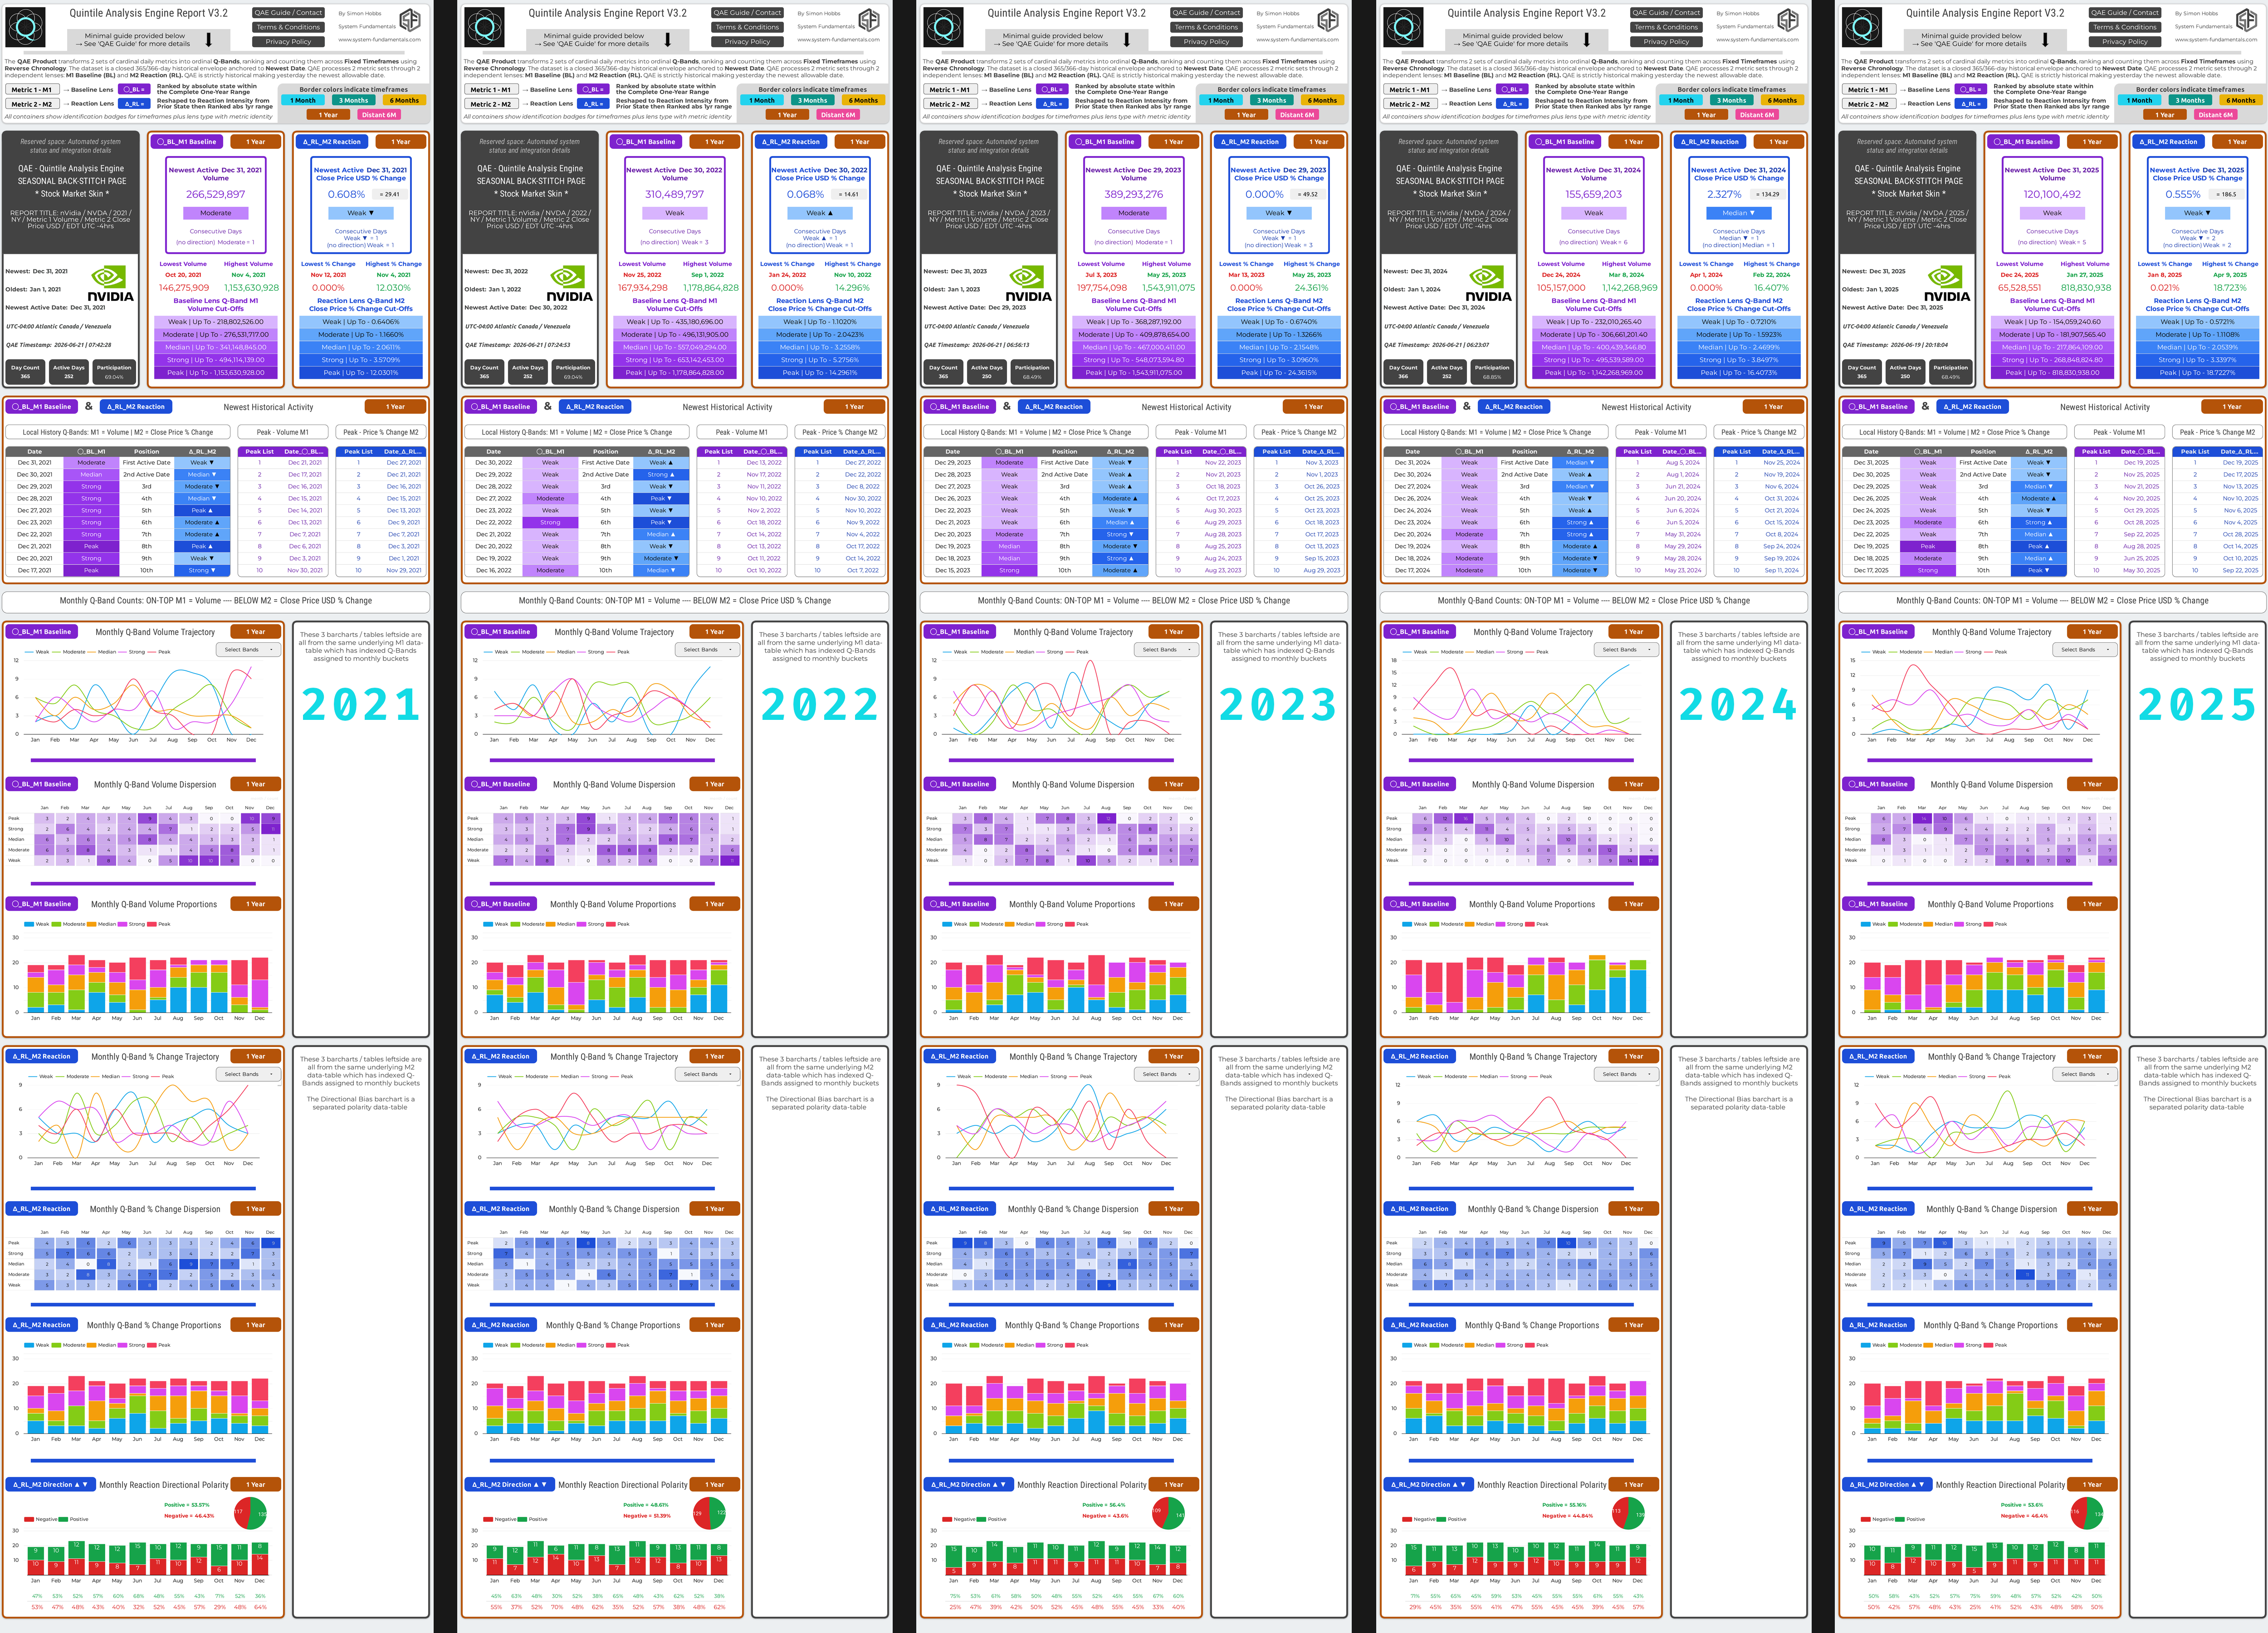
A Decade Pack is a derivative product of the standard QAE Report. The QAE one-year dataset envelopes are independent yearly Event Capsules which are treated as tiles in a visual geometry PDF. The QAE Engine computes time using Reverse Chronology, it anchors to the Newest Date and processes each month retrospectively.
This Reverse Chronology allows Back-Stitching to tile to infinity if the data is available, meaning the Decade Pack PDF was simply clipped at 10 tiles to create a continuous, decade-long visual macro perspective of seasonal behavior. The current standard Decade Pack consists of exactly 10 fully independent seasonal tiles running from January 1, 2016, to December 31, 2025, inclusive.
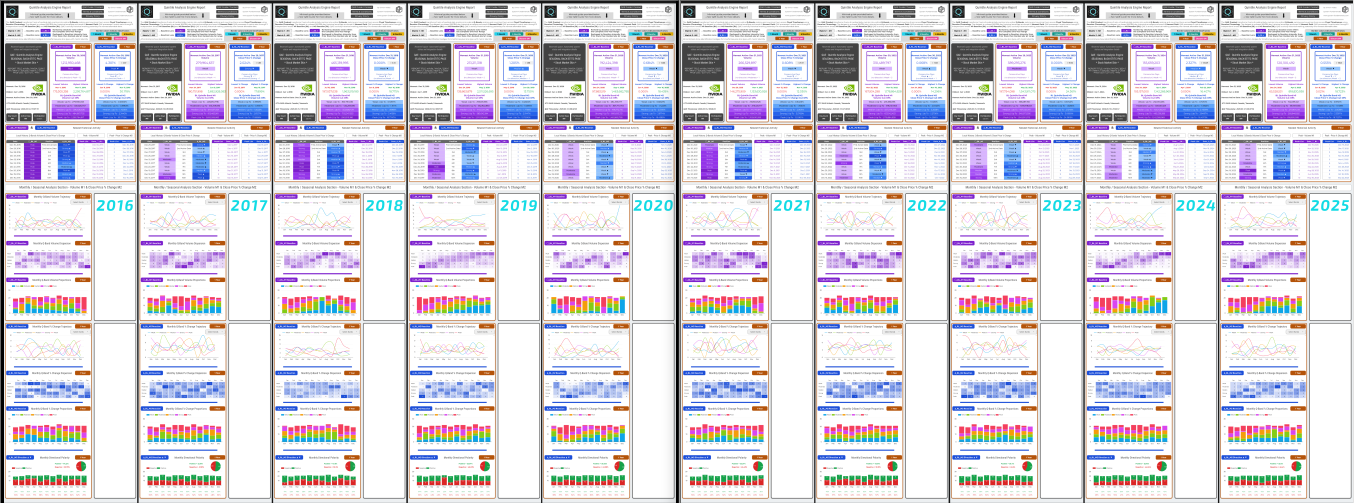
Use quick links in the sidebar to view the QAE Decade Pack Demos. Below illustrates a continuous wireframe construction showing the Back-Stitch macro perspective. Below that is a wide frame image, a 10-year Decade Pack.
Back-Stitching Wireframe Tiling Illustration (Partial Decade Pack)
/                           /                          /                          /                          /
/ Oldest Date   Newest Date / Oldest Date  Newest Date / Oldest Date  Newest Date / Oldest Date  Newest Date /
/ 1 Jan 2022    31 Dec 2022 / 1 Jan 2023   31 Dec 2023 / 1 Jan 2024   31 Dec 2024 / 1 Jan 2025   31 Dec 2025 /
/                           /                          /                          /                          /
/ ●                       ● / ●                      ● / ●                      ● / ●                      ● /
/ │                       │ / │                      │ / │                      │ / │                      │ /
/ │<────── 2 0 2 2 ──────>│ / │<────── 2 0 2 3 ─────>│ / │<────── 2 0 2 4 ─────>│ / │<────── 2 0 2 5 ─────>│ /
/ │                       │ / │                      │ / │                      │ / │                      │ /
/ ●                       ● / ●                      ● / ●                      ● / ●                      ● /
/                           /                          /                          /                          /
.
.
The Decade Pack is defined by the following architectural rules:
- The Geometry of Time (Reading Flow): The newest month is always on the right side, with historical months incrementally ordered to the left to complete a 12-month set. This reads oldest to newest as a standard timeline, naturally extending to multi-year sets.
- Seasonal Re-indexing: Seasonal re-indexing reorganizes the data into 12 strict calendar month containers. Because monthly indexing is used, a split month (not locked to a month-end date) will by definition contain data in its initial month from both the current and previous year, creating structural distortion in the first monthly container.
- The Law of Zero Blending: Tiling is a purely visual alignment with zero computational blending, meaning a massive volatility shock in one mathematically isolated Event Capsule cannot contaminate the structural truth of adjacent years.
- Rapid Macro Analysis: The Decade Pack delivers a 10-year perspective in a single view. The 10-tile layout allows the human eye to rapidly scan seasonal macro behaviours such as persistence, recurring decay, clustering, regime shifts.
QAE Decade Pack Bundle
The QAE Decade Pack Bundle is a Decade Pack deliverable product comprising:
- 1 x Back-Stitch Pages 2016-2025 - 10-page PDF
- 10 x Back-Stitch (Tiles) Page 1-year - 1-page PDF
- 10 x QAE Report 1-year Summary / Data tables TXT
- 1 x QAE Report (most recent) - 2-page PDF
- 1 x readme.txt
- Intended Phase 1 Assets: NVDA (Free) | TSLA | AMZN | MSFT | XOM | BTC | QQQ
How to Use 10 Back-Stitch Tiles: The QAE Decade Pack, either printed or on screen, allows the user to arrange individual tiles locally for focused inspection. Also, a single 10-page PDF archive is included of the same 10 tiles.
Product Updates (Until January 2027): To continuously improve the product, free updates—including template updates, skin updates, and other improvements—can be accessed after purchase up until the end of January 2027. For the moment, these free updates will be managed and delivered manually via email. However, the delivery infrastructure must transition to a CDN (Content Delivery Network) at a later date.
CDN Transition & The Forever Keeper: When the CDN delivery system is fully established, the "Forever Keeper" mechanism can be activated. Once activated, new yearly extensions can be added each January. For approximately $3 to $5 per Decade Pack, each January update delivers a completely new Decade Pack produced with the latest engine and template improvements — not simply a bolt-on year extension. This is low cost and optional, not a subscription model. Reminders can be issued by email.
Beta Funding Mechanism & Asset Rollout: The QAE Project is currently in an early-access beta phase and requires funding to support ongoing system development and automation. To facilitate this, financial Decade Pack Bundles are being released as the primary funding mechanism for the project. Because major financial markets naturally possess the high-resolution data required for strict quantile distribution, the available deliverable assets will initially be exclusively financial. The rollout of these assets will occur in two distinct stages:
Stage 1: The Initial 5 (Developer Curated): The first release will offer 6 specific stock Decade Packs curated directly by the system developer. These will focus on major, high-liquidity equities to provide Pattern Investigators with immediate, high-quality historical inspection fields.
Stage 2: The Next 25 (Audience Curated in weekly steps): The second stage of the beta rollout will expand the available assets to hopefully 25 Decade Packs. The asset selection for this stage will be driven entirely by the audience or partners. This expansion will introduce a mixture of large cap US equities (NY) and broader macro indicators (such as SPX, TNX, GOLD, and DSX) chosen by the audience.
Bundle Details & Beta Pricing Structure: The Decade Pack Bundle—the decade of visual PDF reports—contains extensive information represented in the detailed report summaries as separate text files. These text files serve as both a summary of key QAE Report details and the original dataset in full. Additionally, a most recent full QAE Report PDF is added as a bonus, as it may be useful for the most recent context.
Availability & Current Delivery: Decade Packs are not available yet. Upon release, delivery will be email-based and non-refundable. To support beta development, the pricing structure is as follows:
- 1 x QAE Decade Pack: $20
- 3 x QAE Decade Packs: $48 — 20% saving
- 6 x QAE Decade Packs: $72 — 40% saving
(Back-Stitch Pages 2016-2025 as individual PDFs and as a single 10-page PDF, QAE Report Summaries, Most Recent QAE Report)
About QAE Development
I am a solo developer and this is a work-in-progress beta release. The QAE Project became more interesting and complex as it unfolded in recent months and now there is much to do in the near term to stabilize and refine templates and this webpage / website. This will be tackled in conjunction with user feedback.
The QAE Decade Packs will be released in limited numbers during the beta phase to fund ongoing development. Pricing is intentionally accessible, with the option to maintain annual Decade Pack updates each January.
The intention is straightforward: A fair price for a decent product that delivers some genuine value.
See more details—click the QAE Project Beta Statement link in the Table of Contents
QAE Website Quick Links to Key Details & Downloads
QAE System Cheat-Sheet
QAE Report Demo
QAE Decade Pack Demo
QAE System Blueprint
QAE NVDA Daily Report
QAE Decade Pack Bundle
QAE All Website TXT
Table of Contents
Contact | Legal
QAE System Overview
-
The Signal
-
Layer A
-
Layer B
-
Layer C
-
Layer D
-
Cheat-Sheet
QAE System Overview
QAE First Principle: Preserve Signal Integrity During Transformation
The way QAE operates is easily visualized as a 4-layer cake with a pole running through the center crossing the path of all four layers. It is an event pipeline running through four operational layers A to D, naturally creating three boundaries or interfaces between them. Each boundary requires a handshake in sequence to keep the operation functional.
This linear and deterministic sequence begins when the user selects or becomes aware of the metrics which form the dataset Query (Layer A) for submission to the QAE Engine. The engine executes computation and quantile unpacking (Layer B) to preserve the signal and transform raw data into an ordered ordinal dataset. Next, the engine maps this data directly onto a static grid to render the visuals (Layer C). The event pipeline finally terminates at interpretation (Layer D), where the visual patterns expose a geometric Message for the user to rapidly read and re-engage with via the QAE Report.
QAE System Blueprint
- The Blueprint below is a condensed text overview of the QAE System Beta for The Decade Pack Product Launch. Click the blueprint to enlarge the image in a new tab
- Preserving the integrity of the SIGNAL throughout this journey is the most critical requirement, enabling the user to parse the visual geometry, extract the embedded MESSAGE, and intellectually satisfy the original QUERY
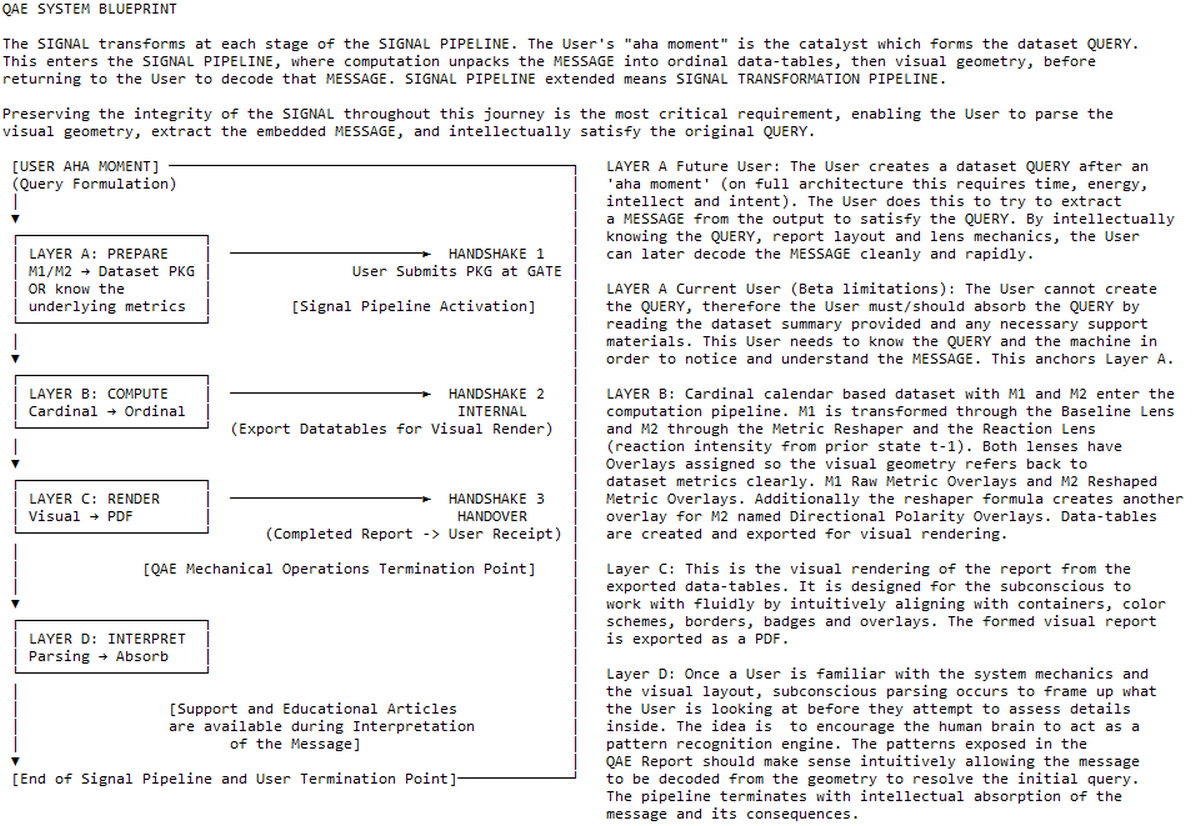
Blueprint Layer A: System Mechanics & Metric Pairing.
The Genesis & The Package: The formulation of the dataset QUERY begins with the primary task of capturing a static historical event snapshot bounded within a fixed one-year calendar envelope. Preparing this source dataset package for system ingress requires selecting two distinct, symbiotic daily metrics that form a natural pairing to represent that specific 365/6-day historical instance.
The Natural Metric Pairing (M1 & M2): To create useful geometry, the QAE Engine requires objective inputs possessing structural utility. Metric selection is not constrained by data type; rather, the objective is to establish a meaningful, repeatable relationship between the chosen pair. It does not matter if the pairing is a traditionally learned market behavior or a fundamentally robust physical law. Provided the pairing makes sense to the Baseline Lens and Reaction Lens, capturing this natural relationship creates the geometric value within the QAE Report.
M1 (Baseline Lens) — Absolute Environmental State: Metric 1 defines the absolute state, physical volume, or absolute environmental participation over the bounded one-year calendar envelope. It acts as the structural landscape, capturing the absolute cardinal magnitude of the event to anchor the environment of the dataset.
M2 (Reaction Lens) — Daily Velocity of Change: Metric 2 must include a daily measurement strictly associated with the calendar. It defines the daily reaction as the response or velocity of change relative to the prior state (t-1).
(During Layer B Computation, M2 is deterministically processed through the Metric Reshaper formula—[Current Metric - Prior Metric] / Prior Metric—which extracts the pure proportional intensity of the daily reaction from the immediately preceding active day).
Handshake 1 (Dataset Ingress Gate): The submission of the dataset Query at the gate. The dataset must pass validation at ingress to activate the SIGNAL PIPELINE, moving the data from the External Domain into the Machine Domain.
User Guide: The Dataset Query
In the full system architecture, a dataset QUERY begins with a user experiencing an 'aha moment' that generates a query to solve a problem. With QAE, that dataset Query contains deterministic cardinal data bounded within a fixed one-year calendar envelope, using two symbiotic metrics to capture a historical event snapshot. The user invests time, energy, and intent to select the timeframe and a natural metric pairing—M1 Baseline and M2 Reaction—driven by precise knowledge of the relationship between those two metrics. To create geometric value, this pairing must establish an interaction between the absolute environment as a whole (M1 Baseline Lens: the absolute state over the year) and the intensity of the resulting daily movement (M2 Reaction Lens: the daily velocity of change relative to the prior state).
The M1 Baseline Lens simply applies ordinal ranking to the metric data and bins it into five symmetric 20% Q-Bands named Weak | Moderate | Median | Strong | Peak.
The M2 Reaction Lens is the Daily Velocity of Change. M2 is deterministically processed through the Metric Reshaper. This M2 metric should contain patterns at the daily time interval regarding the velocity of change, response intensity, or proportional violence relative to the prior state (t-1). Following the Metric Reshaper this lens applies the same symmetric 20% Q-Bands, Weak | Moderate | Median | Strong | Peak.
The Current Beta Status: In this early launch phase, the datasets for the demos have already been curated and processed in advance. Even so, users should absorb the Query details from the QAE Dataset Summary provided with each report. It can be useful to view QAE similar to a calculator—knowing the numbers going in is pretty essential to understanding the numbers out.
LAYER B: QAE COMPUTATION (The Machine)
.
Metric: A non-negative, measurable value derived from physical reality or industry participation (e.g., Volume or Price).
Cardinal Value: An absolute, independent measurement that answers the question "How much?".
Bipolar Value: A signed numerical result (+ or -) generated by the Metric Reshaper formula before it is normalized into a non-negative magnitude for ranking.
Directional Polarity: The independent visual binary extracted from a Bipolar Value that anchors the direction of a move without contaminating its ranked intensity. Shown as ▲ / ▼ on Q-Bands and Green / Red on barcharts.
Ordinal Value: A relative structural rank (e.g., Weak to Peak) that answers "Compared to what?" within a closed 365/366-day envelope.
Ordinal Geometry: The stabilized visual arrangement of ordinal values into fixed architectural coordinates and time-indexed containers.
The Ingress - Lens Classifications M1-BL & M2-RL: The inbound dataset package must be a 3 column metrics data-table | Date | Metric 1 BL | Metric 2 RL | . The package only needs to include Active Days, and metadata required is a Newest Date and a UTC Timezone Offset. The title and logo are useful and optional metadata. Datasets can be encrypted by multiplying the metrics with a complex number. The Ordinal Geometry holds pattern, although the metrics overlays would have distorted values.
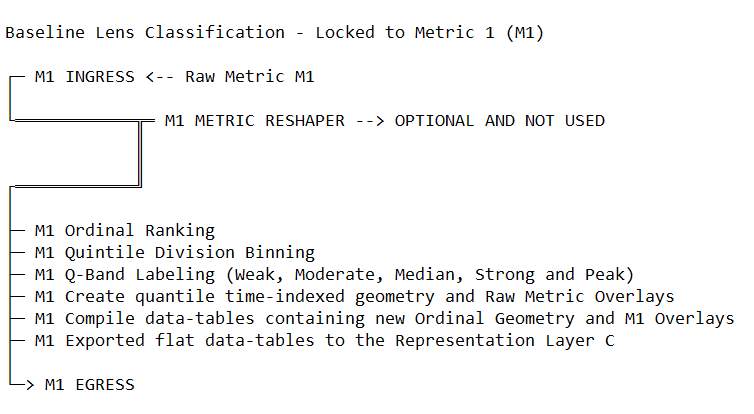
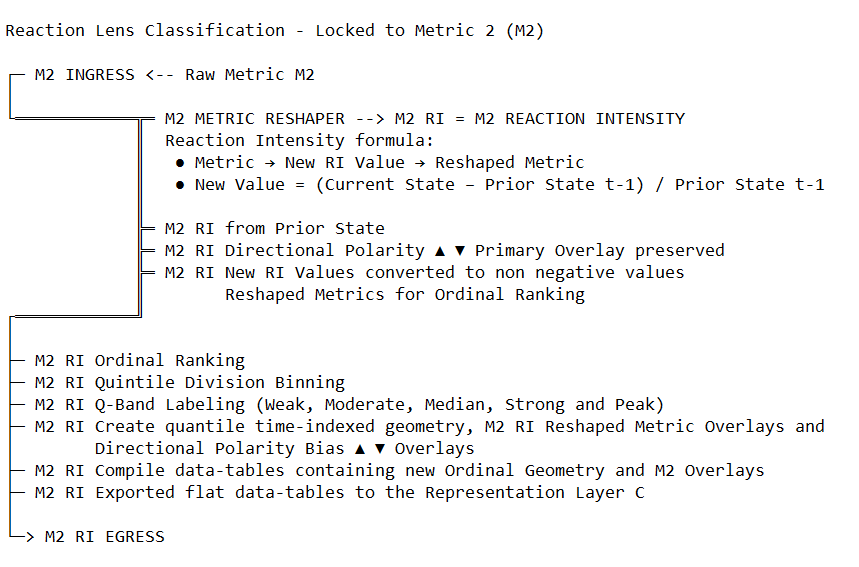
Computation transforms measurable real world metrics into quantile structure using time-indexed ordinal geometry with overlays. The metrics one-year daily interval dataset contains Metric 1 Baseline Lens and Metric 2 Reaction Lens. This metrics pairing enters the computation pipeline as a Deterministic Cardinal Historical Snapshot, not a data-stream. QAE Engine processes both - Metric 1 is processed directly through the Baseline Lens to establish the absolute environmental state - While Metric 2 is routed through the Metric Reshaper creating Bipolar Values as reaction intensity relative to the prior state (t-1), additionally preserving directional polarity binaries. As illustrated in the Reaction Lens Classification map, this allows QAE Engine to process the dataset from two distinct angles of reality.
The Physics of Reverse Chronology: The QAE Engine operates using Reverse Chronology as a design choice which can be changed later on if required. The Newest Date serves as the primary temporal anchor for the dataset envelope and may be either an Active or Inactive Day. The computation anchors to the Newest Date from the metadata and reaches backward through formula exactly 1 year to establish the Oldest Date. This temporal anchor ensures that every Q-Band Count and seasonal distribution is derived from a closed historical envelope, preventing the engine from "hallucinating" trends, blending or looking into the future.
Handshake 2 (Ordinal Geometry Data-tables): Upon the completion of the cardinal-to-ordinal transposition, the machine generates the Ordinal Geometry Data-tables. These flat data-tables contain the finalized Q-Band Counts, Metric Overlays, and Directional Polarity Bias Overlays. This marks the internal handover (Handshake 2) where the Computation is exported to Layer C for visual rendering.
.
LAYER B: USER ORIENTATION
.
Day Qualification Logic: The QAE Engine recognizes three distinct day types. Active Days are daily observations where both metrics are present and are processed by the engine. Inactive Days (weekends or holidays) are skipped without breaking the mathematical sequence; the "Prior State" (t-1) is always the immediately preceding Active Day. Disqualified Days, where a single metric is present and another is missing, are rejected as invalid at the submission gate, and the dataset package submitted will be declined along with an error report.
The Core Math (Cardinal to Ordinal): QAE Engine focuses on structural reality. It deterministically transposes cardinal measurements into Ordinal Geometry using five symmetric 20% Q-Bands: Weak | Moderate | Median | Strong | Peak. The system creates time-indexed geometry where each of the Q-Bands is tested against various fixed timeframes to create the Q-Band Counts rendered in the final charts and tables.
The M2 Metric Reshaper Pipeline: To measure the proportional violence of transitions, the M2 raw metrics are transformed using the formula: (Current State - Prior State) / Prior State. As shown in the Reaction Lens Classification map, this formula creates a bipolar value encoding both magnitude and direction. The engine then normalizes these values to all be positive values, ensuring the system ranks pure Proportional Violence—treating a massive crash and a massive spike as identical "force" for quantile placement.
Directional Polarity Decoupling: Before ranking the intensity, the engine extracts the mathematical sign (+ or -) as an independent Directional Polarity Overlay. This facilitates Directional Polarity Counts for various timeframes. This separation ensures that directional bias never contaminates or masks the ranked intensity of the reaction. Directional bias is shown as ▲ / ▼ on Q-Bands and Green / Red on barcharts.
Baseline Lens MapClick map to enlarge
|
Reaction Lens MapClick map to enlarge
|
Layer C: Visual Rendering & QAE Report Handover
.
Layer C documentation is under development, awaiting future updates and will later include a map of all the containers and elements in the QAE Report. Key information is presented in bullet form for this layer with an update pending. Please also view the QAE Cheat-Sheet with this layer.
.
- Layer C performs visual panel construction picking up from Layer B computation. It is strictly an assembly phase, translating the computed ordinal data-tables from Layer B into a fixed layout digital display panel.
This representational process organizes the deterministic outputs using structured combinations of data, symbols, containers, badges, aesthetic color systems, and spatial arrangement. See QAE Cheat-Sheet. - The fixed layout relies on placement discipline, assigning coordinates to elements so the structure makes sense and becomes more natural to cognitively engage with after some sessions.
- Container Architecture utilizes specific borders and badges to securely isolate data scope and prevent unrelated structures from blending together.
- Invariant visual grammar relies on strict aesthetic color systems: Purple for the Baseline Lens ◯_BL_M1, Blue for the Reaction Lens △_RL_M2, and dedicated colors for fixed timeframe badges and borders.
- The 5-tier ranked Q-Bands are aesthetically displayed using a consistent light-to-dark color gradient ranging from Weak to Peak.
- Directional Polarity Indicators (up/down or higher/lower) are placed as ▲ ▼ Arrows in M2 Q-Bands, while charts display Directional Polarity Counts utilizing Green for a positive move and Red for a negative move. This physical placement ensures Directional Polarity never visually or mathematically contaminates the quantile output in the ordinal geometry.
- Template Skins allow domain-specific semantic labels (such as "Volume" or "Mean Wind") to be applied to the labeling without altering the underlying mechanics of the engine.
- Layer C officially terminates at Handshake 3 (QAE Report Handover), exporting the static QAE Report PDF and transferring full operational responsibility outward to the user for interpretation at Layer D
- The QAE System Timezone Metadata currently relies on a hard UTC offset to lock the dataset time (e.g., NY displays as UTC-5hr or UTC-4hr depending on when the report was created). While this is internally functional for preserving the timestamp, this labeling can appear confusing and is flagged for future template/skin improvement.
Layer D: User Interpretation
.
Part 1: Subconscious Parsing
Subconscious parsing is built on reliable, repeatable patterns. When someone learns to drive, they spend time normalizing to the controls and displays. After a few sessions, drivers begin to operate automatically — able to daydream or multitask occasionally, then later on with more practice multitask frequently. This happens because the ergonomic design of car controls aligns with the human body, allowing the subconscious to take over routine tasks.
A similar thing happens when learning one new language, after a certain amount of practice learners start thinking in that new language without the mental load of translation to the default language because their subconscious became structured enough to bypass using the previous dominant default language.
A similar principle applies to QAE. It projects a consistent, repeatable layout geometry that the subconscious can quickly internalize. By enforcing an invariant visual grammar through strict placement discipline, the architecture establishes a stable perceptual field. After some sessions and usage, people start instinctively knowing what they are looking at and where everything is. This biological division of labor assists rapid re-engagement, allowing the brain to significantly reduce searching for where information lives thereby freeing the mind to concentrate on data content and the underlying query.
.
Part 2: Interpretation & System Support
.
- The Boundary of Interpretation: The machine's mechanical responsibility strictly terminates at QAE Report Handover, marking the point where full operational responsibility returns to the User. The engine builds geometry and delivers a report. It does not offer advice, generate predictive models, or assign value. Meaning is entirely the User's domain.
- System Support & Education: Because the engine only provides deterministic structure and never interprets the data, the QAE ecosystem currently provides early version support with this website content which will include educational articles later on. These resources will grow and improve to assist Users in understanding the dataset details and the underlying mechanics needed to decode the messages and meanings within QAE Reports.
- Conscious Deduction: Interpretation is the conscious act of translating geometric patterns into actionable, real-world consequences based on specific domain knowledge. The system provides the visual invariant, while the User provides the deduction.
- Connecting Dual Realities: The true power of interpretation happens when the User connects relative Ordinal Position (the Q-Bands) back to absolute Cardinal Magnitude (the raw metric text overlays). Because the QAE Report displays both realities together for total contextual awareness, inspecting a Peak Q-Band rank paired with a historically tiny absolute raw metric reveals that the entire underlying dataset is tightly compressed.
- Pattern Recognition & Systemic Conviction: With the noise of absolute scale removed, the conscious mind is completely free to focus on structural anomalies and behavior.
- Seasonal Recurrence & Decay: By engaging with the historical viewports, the User can observe specific band patterns occurring in the exact same calendar month across Back-Stitched years. This allows the User to interpret reliable seasonal decay, persistence patterns, and macro regime shifts.
QAE Cheat-Sheet
Click the red links to open in a new tab or right click to 'save file as'
Download PDF | Download Image 2560px Tall | Download Image 4000px Tall
Demo 1 Tabs: The QAE Report Demos and Experiments
The five tabbed demo pieces, plus an Experimental Statement using the Standard Template and Template Skins. Firstly the proven NVDA datasets, followed by active beta experiments using raw public data from NOAA Houston Dew Point, Wind Data NW3, and the VIX Index.
.
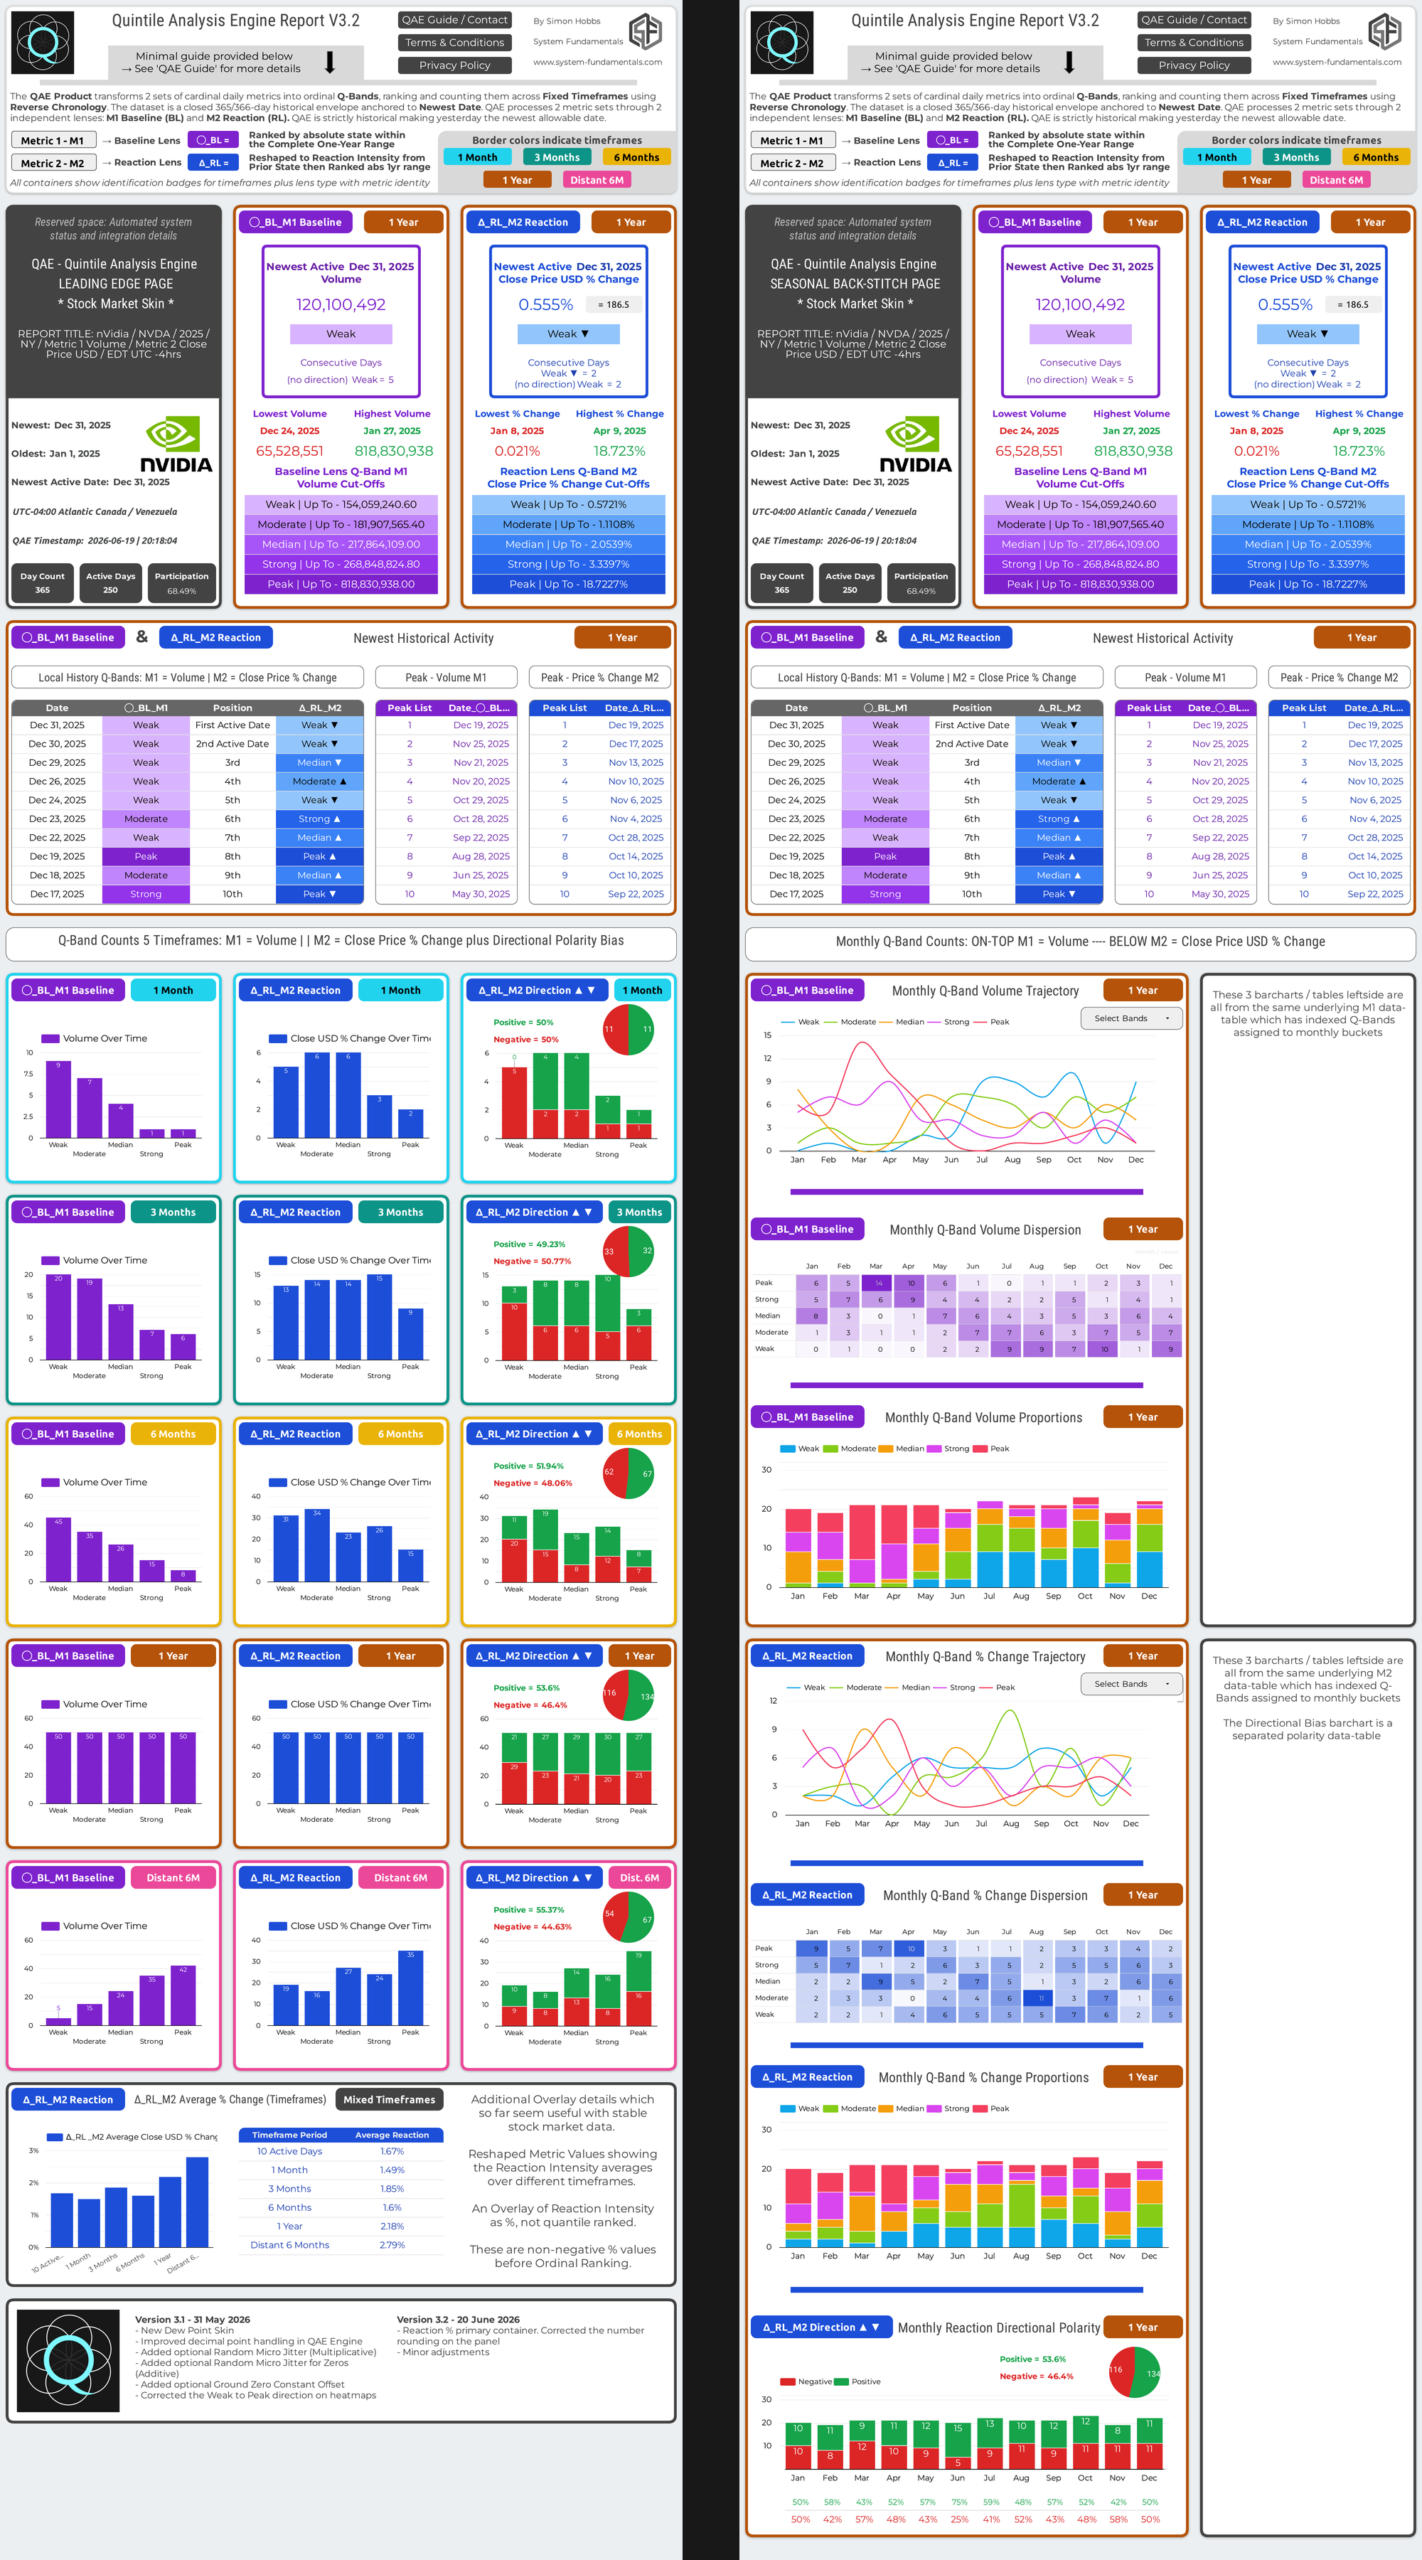
- Tab 1 — NVDA Std-Tpl (NVDA 2025 | Standard Template): A verified, high-resolution metrics pairing with strong, clean patterns containing Volume as the Baseline Lens (BL) and Close Price USD as the Reaction Lens (RL) to demonstrate the standard template.
- Tab 2 — NVDA Stocks-Skn (NVDA 2025 | Stock Market Skin): The identical high-resolution baseline data as Tab 1, utilizing a custom skin to show how standard industry labels apply to the visual panel for a trader.
- Tab 3 — Experimental (E): The core testing framework. This section outlines the internal engineering rules and procedures for handling different, non-standard dataset types to prove the engine’s domain-agnostic capabilities.
- Tab 4 — E1 HTX IAH DP-Skn (Houston IAH Experiment 2024 | Dew Point Skin): An experiment testing the domain-agnostic claim by decoupling from human activity and applying the engine directly to raw NOAA physics data, formatted with a custom dew point skin.
- Tab 5 — E2 Wind LDN Std-Tpl (Wind Experiment London NW3 2025 | Standard Template): A second domain-agnostic experiment running raw atmospheric wind speeds through the un-skinned standard template to test fluid natural dynamics.
- Tab 6 — E3 VIX Std-Tpl (VIX Anomaly Experiment May 2026 | Standard Template): An interesting edge-case experiment analyzing high resolution synthetic institutional data rather than a physics measurement like temperature. Because VIX is driven by a formula which deliberately includes imbalanced, asymmetric modeling, this experiment flags how the QAE Engine flags these inconsistencies, showing structural issues and potential interpretation challenges that can occur when a dataset does not behave like natural physics. If someone is already normalized to VIX, the report should still be useful because the VIX dataset is processed identically to all others.
QAE Report Demos
-
NVDA Std-Tpl
-
NVDA Stocks-Skn
-
Experimental (E)
-
E1 HTX IAH DP-Skn
-
E2 Wind LDN Std-Tpl
-
E3 VIX Std-Tpl
Dataset SummaryNVDA 2025-01-01 — 2025-12-31 • Click image to enlarge Wireframe Summary |
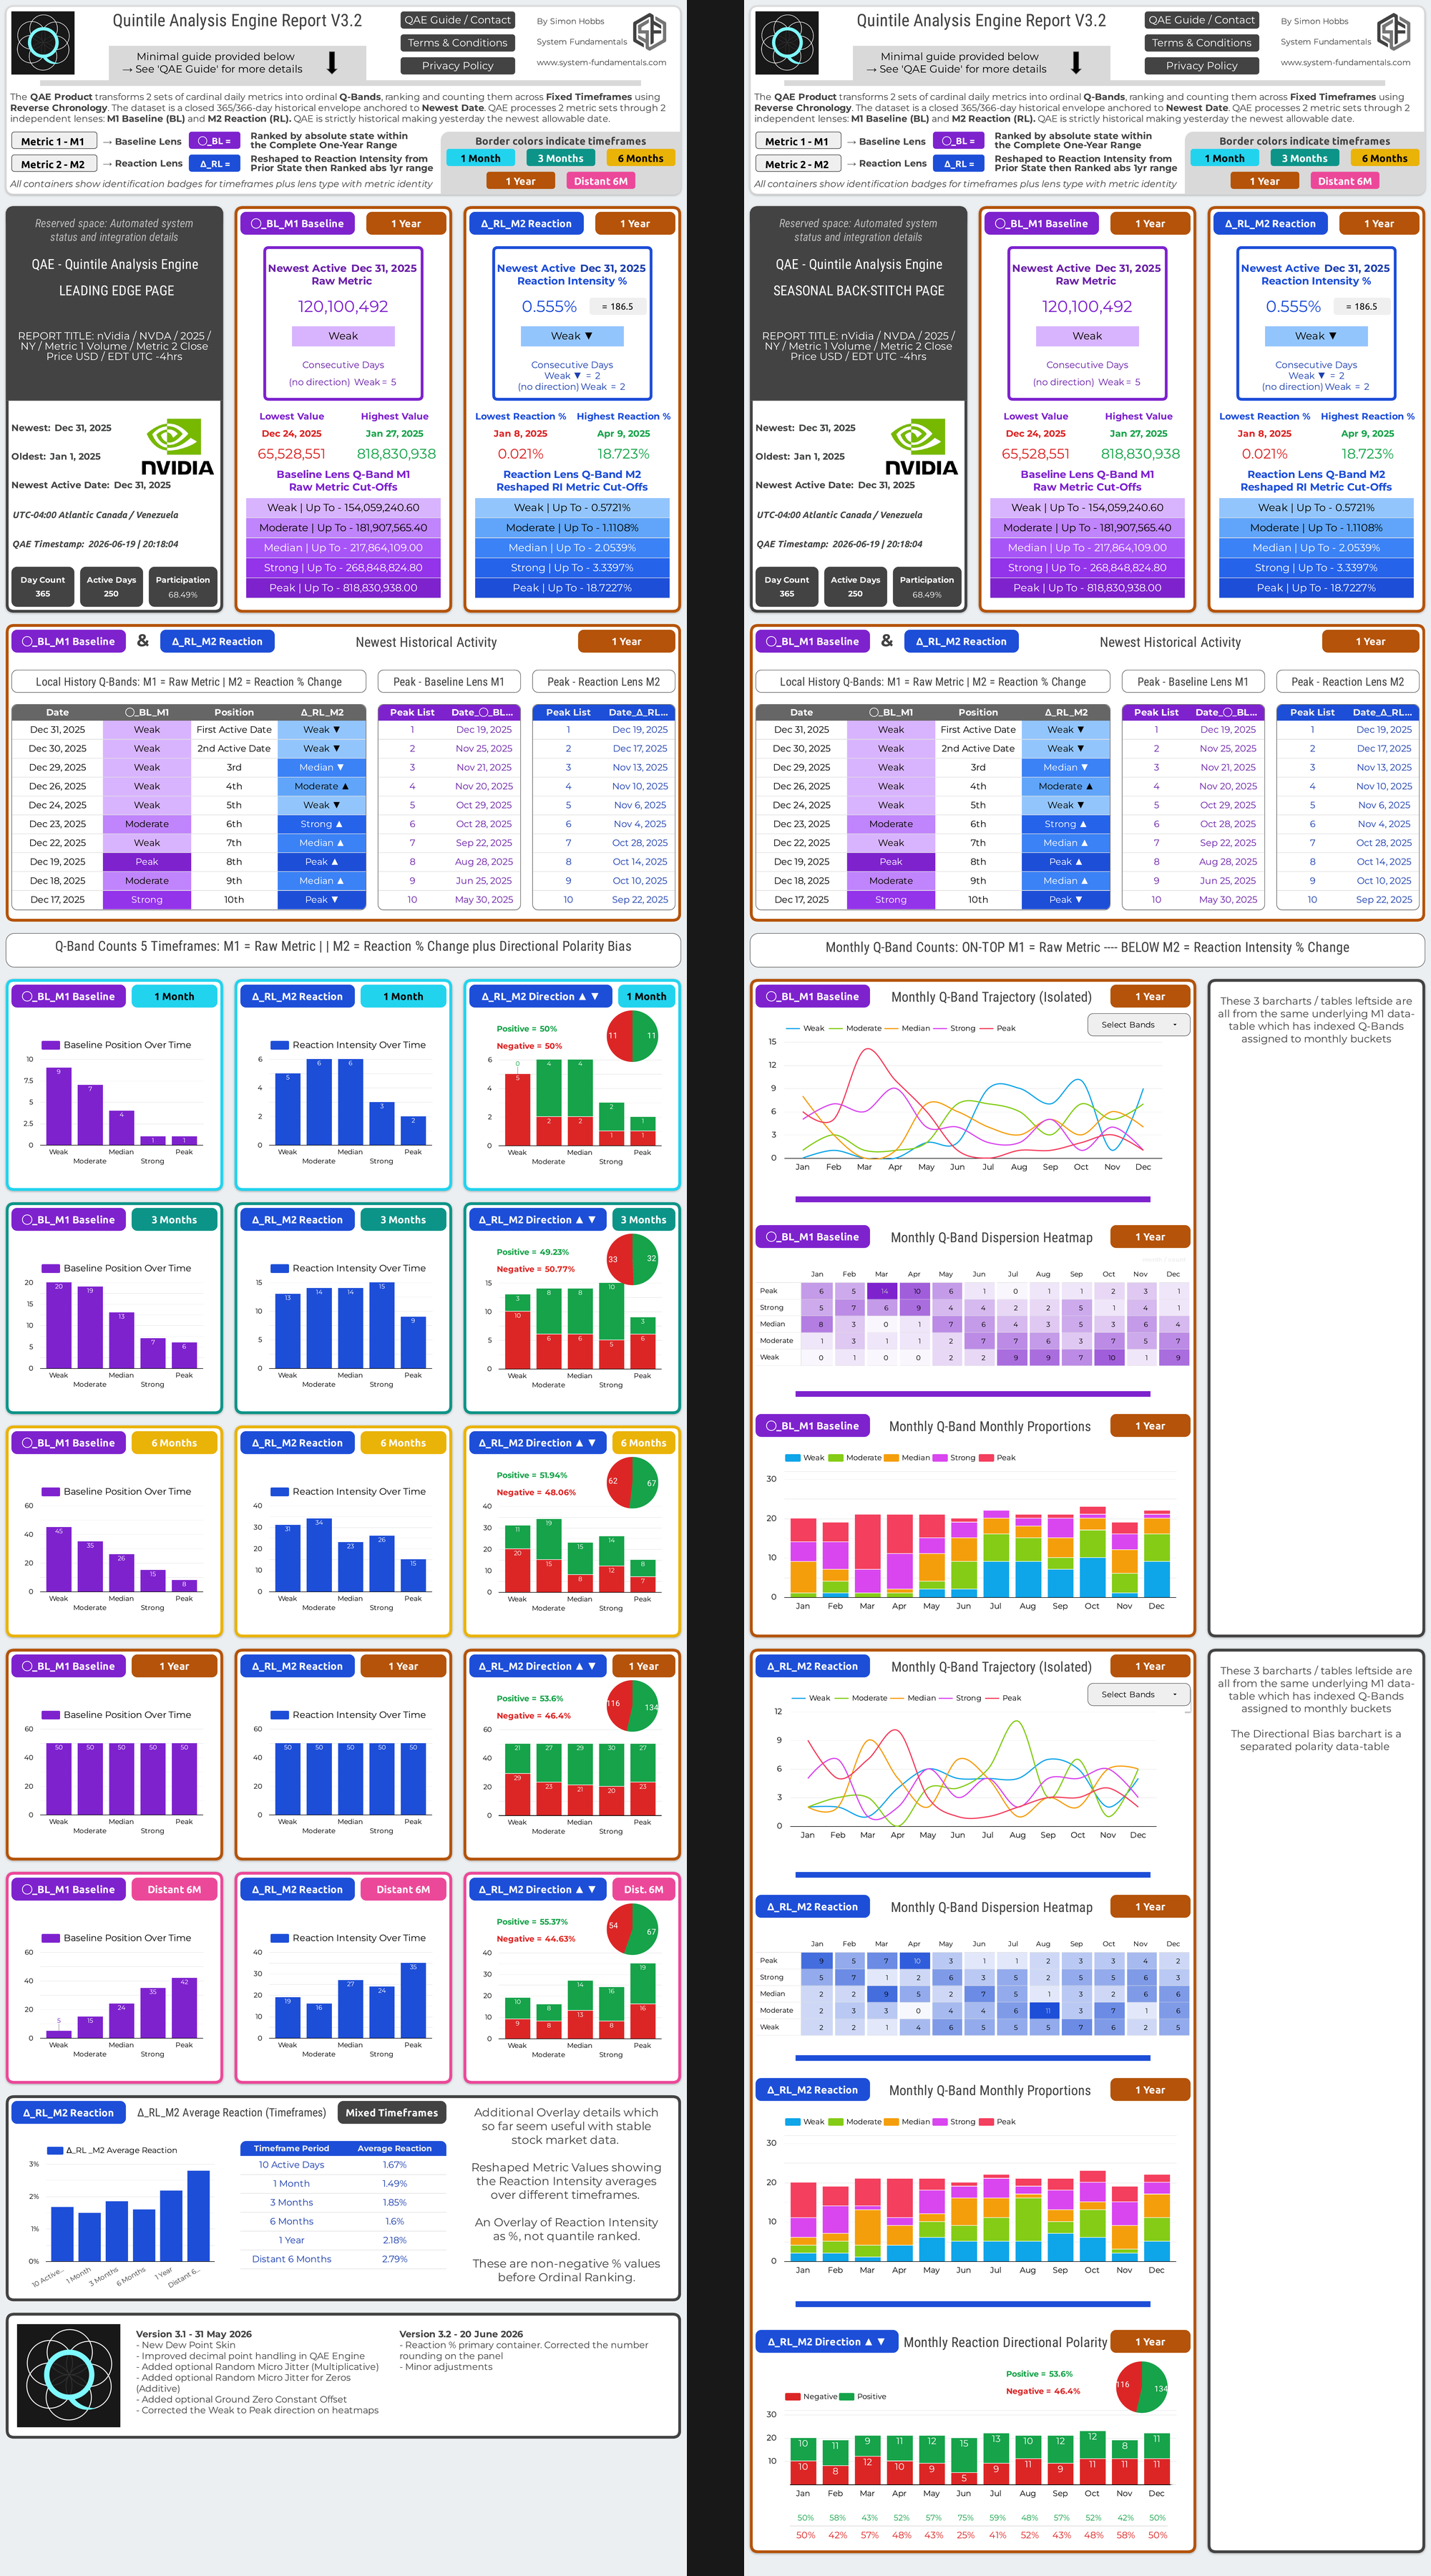
NVDA QAE ReportQAE Standard Template • Click Image to enlarge QAE Report |
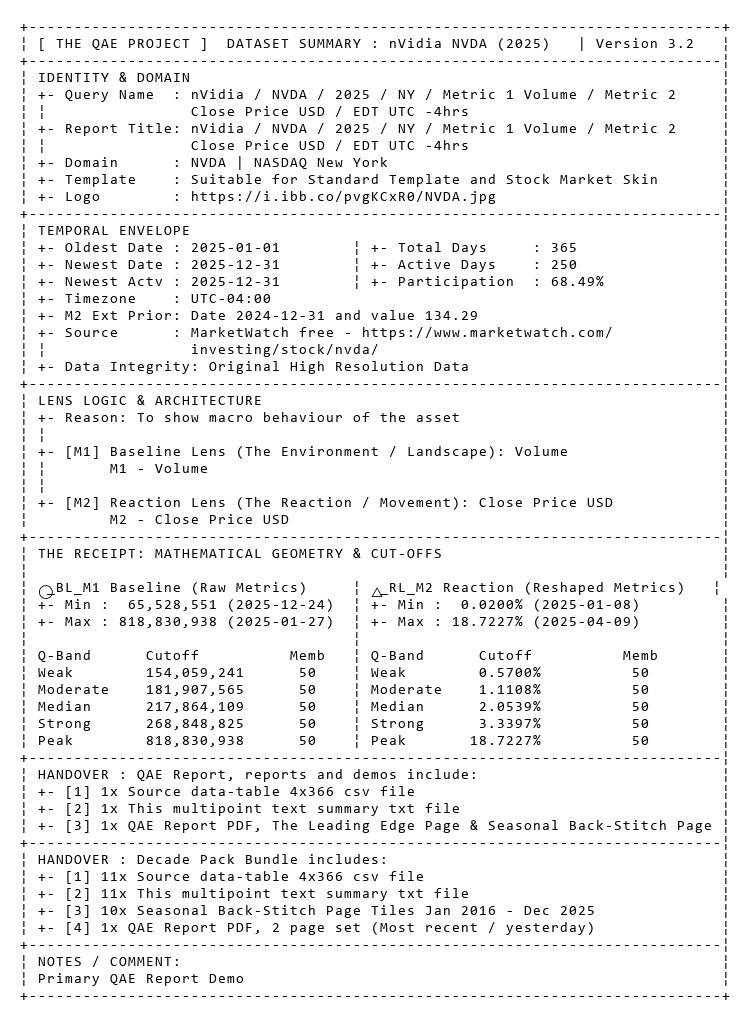
Dataset SummaryNVDA 2025-01-01 — 2025-12-31 • Click image to enlarge Wireframe Summary |
NVDA QAE ReportQAE Stock Market Skin • Click Image to enlarge QAE Report |
QAE Engine and the Dataset Dance
The Key Validation is Symmetrical Q-Band Distribution
QAE Engine partitions one year of daily metrics into five equal parts through quintile binning, which are then labelled Q-Bands. To produce a report with pattern depth, QAE Engine needs a certain resolution depth and range to establish patterns—no excessive duplicates, no excessive zeros. Also, the M2 Peak Cutoff Value can explode into thousands of percent if the calm state of the M2 metric sits near zero (examples could be wind, wave, rain data), the baseline ground zero of that metric can optionally be raised with a Ground Zero Constant Offset this resolves to the Peak Cutoff Value having a perceptually realistic value.
M2 has a peculiar problem: It measures change, so if consecutive M2 rows have identical values, nothing changed in the real world and therefore there is nothing to measure. Those instances create a zero in the pipeline which fractures Q-Band distribution.
Q-Band Distribution Rules:
- For 365 active days the required split is 73·73·73·73·73.
- For 251 active days (common for stocks) the split must be 50·50·50·51·50 (the 51 may sit in any Q-Band).
- Q-Bands must be equal or all values can never be more than 1 in difference such as this valid distribution 61·61·60·61·60.
- These are examples of failed Q-Band distributions for 365 days, 73·75·72·73·72 fails. Or for 250 active days, an incorrect distribution could be 48·50·51·52·49.
Every QAE Report self-validates on the Leading Edge page, 4th row of bar charts, on the 1-year timeframe. These Q-Band Count aggregates show the complete Q-Band distribution for the 1-year timeframe. If the counts match the required split, the dataset is valid. No further checks, no changes.
If the counts do not match, the dataset has failed step 1 which leads to --> Diagnose --> Resolve OR Reject.
The 2 Zero Problems
- Duplicate zeros break distribution: Zeros are immune to Multiplicative Bidirectional Random Micro Jitter (a zero does not change when multiplied). Therefore when zeros appear as duplicates that break the distribution, we must use Additive Random Micro Jitter for Zeros Only—tiny random numbers added solely to the zero values.
- Near-zero values create M2 denominator extremes: The M2 Reshaper formula is (Current – Prior)/Prior. When the prior state is very close to zero, the denominator is tiny and the result can exceed 1000%, producing a meaningless Peak cutoff. This does not damage the underlying geometry, but it creates an unnecessary perception distortion of the M2 Peak Cutoff value. The fix is to optionally apply a Ground Zero Constant Offset to the whole metric, moving the floor away from zero before the Reshaper runs.
Metric Classes Analog and Industrial
Pure Analog Class – Natural physical metric measurements: Wind speed, wave height, temperature. These are continuous and natural. True duplicates and absolute zeros do not exist in natural analog metrics. A broken distribution with Pure Analog Metrics means human recording has likely truncated and applied data—rounding destroying the original resolution in the data. NOAA public data is an example of this as they record and store temperature as °F integers.
Industrial Class – man made, commercial, financial metrics: Production counts, defect tallies, transaction volumes, prices. These are discrete. Legitimate zeros and identical consecutive values are normal. A broken distribution in this class reflects a dataset with an inability to form useful patterns due to a lack of resolution. QAE Engine has a thirst for resolution to render patterns.
Industrial High-resolution: Major stocks, financial data and commodities retain high-liquidity with high resolution in digits over a very workable range. This is why there are so many successful financial data analysis tools. Financial data usually bottoms out well above zero and they use the identical formula as QAE Engine to express the daily percentage close price movements on the news. NVDA daily volume and close price naturally possesses minimal duplicate clustering and passes QAE distribution check without changes every time.
Diagnostic Checklist
Use only when a distribution has failed. Use checklist to comment where appropriate to resolve a Q-Band distribution problem
- No excessive duplicate clusters in raw M1 or M2
- No excessive zeros in raw M1 or M2
- No excessive identical consecutive values in raw M2 (creates zeros in the reshaped pipeline breaking distribution)
- Sufficient range resolution (guideline: data spans a range capable of distinguishing patterns, leaning towards at least a 999-value range)
- Sufficient digit resolution (guideline: digits before and after the zero are capable of distinguishing patterns, leaning towards at least a 999-value range)
- Primary physics measurement type where applicable – Kelvin functions far better than °C or °F in QAE Engine. °C/°F are useful but not primary; they also place the zero in an awkward position.
- M2 floor somewhat above zero, optional fix (near-zero prior states often create Reshaper denominator extremes)
Dataset Response Card: One card per dataset, showing actual values against each requirement.
- Distribution | X, X, X, X, X | PASS or FAIL
- Duplicate count M1 | number
- Duplicate count M2 | number
- Zero count M1 | number
- Zero count M2 | number
- M2 adjacent duplicates (identical consecutive rows) | number
- Resolution digits | left number & right number
- Resolution range | lowest number → highest number
- Class M1 | Analog / Industrial
- Class M2 | Analog / Industrial
Fix Map For Broken Q-Band Distribution
- M1 / M2 clean non zero duplicates Multiplicative Bidirectional Random Micro Jitter
- M1 / M2 clean zero duplicates Additive Random Micro Jitter for Zeros Only
- M2 clean adjacent identical values Multiplicative Bidirectional Random Micro Jitter
- Metric Type Corrections Convert from °C / °F to °K (Kelvin)
- M2 floor too close to zero Ground Zero Constant Offset (optional as this does not break distribution, this is cosmetic to QAE Engine)
- No applicable fix Hard Fail – dataset rejected
Ingestion Flow
- Submit dataset
- Check Q-Band distribution
- Pass → valid. No changes needed. Proceed to report
- Fail → complete Diagnostic Checklist and Dataset Response Card
- Match failures to the Fix Map. Apply fix(es) and resubmit
- Fix resolves distribution → valid. Proceed
- No fix available, or distribution still broken → hard fail. Discard
Status: Using QAE V3.1
The Houston IAH Dataset ExperimentGeorge Bush Intercontinental Airport (Houston TX) - Dew Point Skin °FDataset Summary: HTX IAH 2024-01-01 — 2024-12-31 | Status V3.1 This experiment is inspired by the moisture & temperature pairing used within ASHRAE psychrometric design methods for commercial HVAC systems. In its original engineering context, psychrometric analysis is performed indoors using highly controlled measurements, typically collected at hourly intervals or finer resolution. QAE is not attempting to replicate psychrometric engineering calculations. Instead, it is adapting the same conceptual framework—a moisture lens paired with a thermal lens—and applying it to district-scale outdoor climate telemetry using NOAA daily summary data at the 24-hour candle. The purpose of this experiment is to explore whether a thermodynamically related metric pairing can generate meaningful geometric structures within the QAE framework. At present, this remains an experimental demonstration rather than a validated atmospheric model. Metric 1 (M1) — Moisture Lens (Absolute Moisture State) Original HVAC Reference: Indoor Humidity Ratio conditions used to identify the annual hours containing the highest atmospheric moisture content. QAE M1 Input: Average Daily Dew Point (ADPT) Relationship: Both the HVAC reference metric and Daily Dew Point are fundamentally associated with the moisture state of the air mass. While they are not identical measurements, both are closely tied to the physical quantity of water vapor present within the atmosphere. Dew point is particularly useful because it is governed by the absolute moisture content of the air rather than short-term fluctuations in relative humidity. As a result, dew point typically exhibits greater physical inertia than temperature and often changes more gradually as air masses move through a region. Within the QAE framework, Daily Average Dew Point is therefore used as a district-scale moisture baseline. Changes in this baseline frequently reflect the arrival, departure, or modification of regional air masses and broader atmospheric moisture conditions. Metric 2 (M2) — Thermal Lens (Thermal Energy State) Original HVAC Reference: Mean Coincident Dry-Bulb (MCDB) Temperature, representing the thermal conditions occurring concurrently with selected high-moisture design periods. QAE Input: Average Daily Temperature (TAVG) Relationship: Both metrics represent thermal state measurements and therefore occupy the thermal side of the moisture–temperature pairing. However, Daily Average Temperature is not equivalent to Mean Coincident Dry-Bulb Temperature. MCDB is a specialised HVAC design measurement linked to specific moisture conditions and selected design-hour events. Daily Average Temperature is a broader district-scale climate measurement representing the average thermal state over a full 24-hour period. QAE therefore substitutes Daily Average Temperature as a macro-scale thermal lens rather than as a direct replacement for MCDB. The objective is not to reproduce psychrometric engineering calculations, but to preserve the conceptual pairing between atmospheric moisture conditions and thermal response. Within the QAE framework, Daily Average Temperature functions as the volatile thermal lens. Unlike dew point, temperature reacts rapidly to solar radiation, cloud cover, weather systems, and short-term environmental changes, making it an effective candidate for the Reaction Lens within the dual-lens architecture. |
The Houston IAH Dew Point Skin QAE Report . • Click Image Below to Enlarge Wireframe Summary 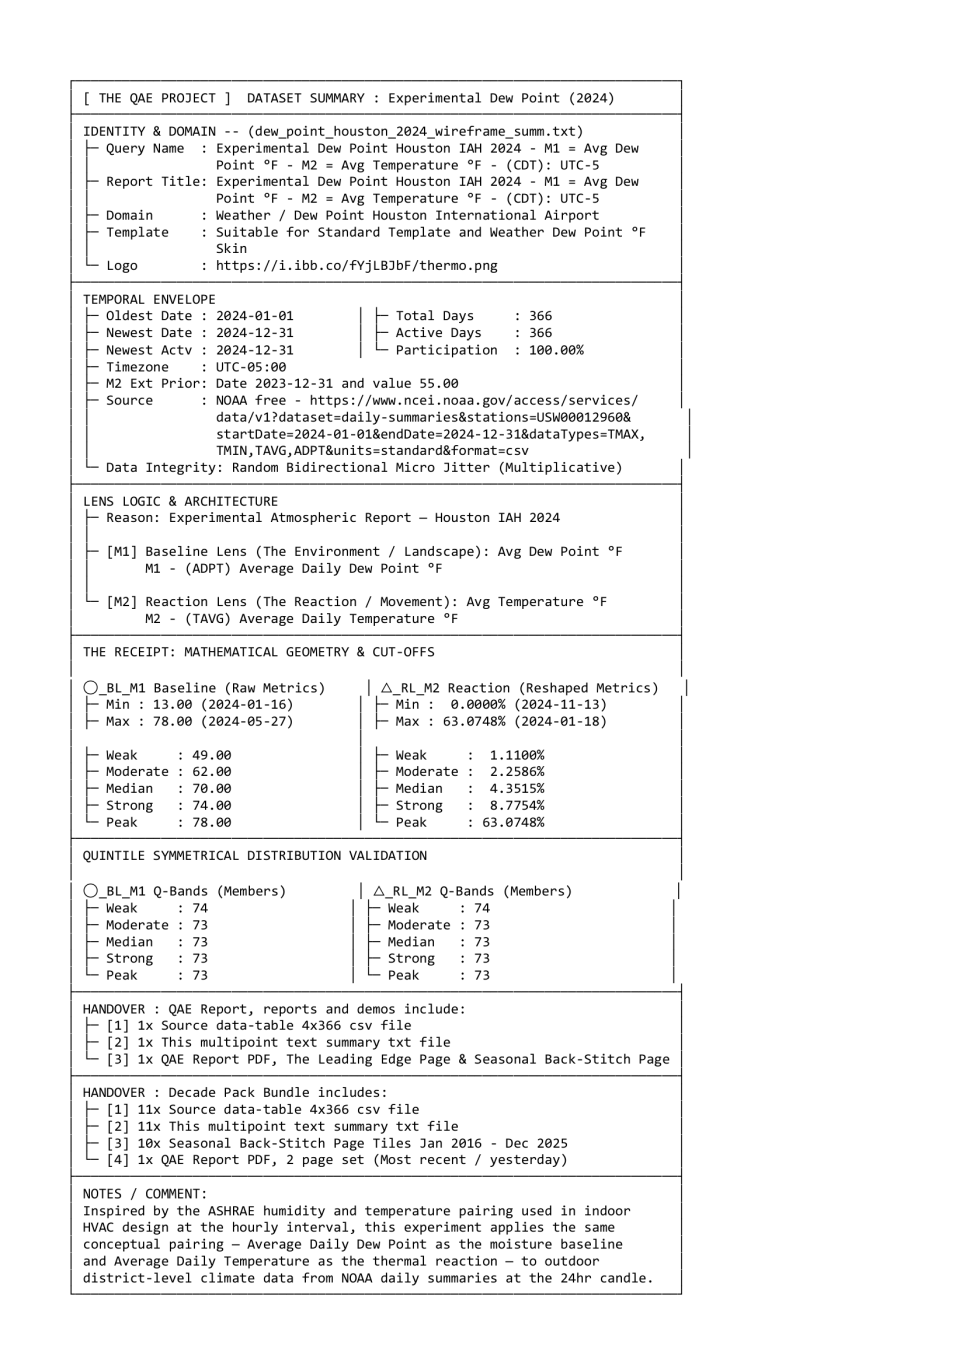 🔗 Right click to download: Data-Tables / Wireframe txt file . • Click Image Below to Enlarge QAE Report 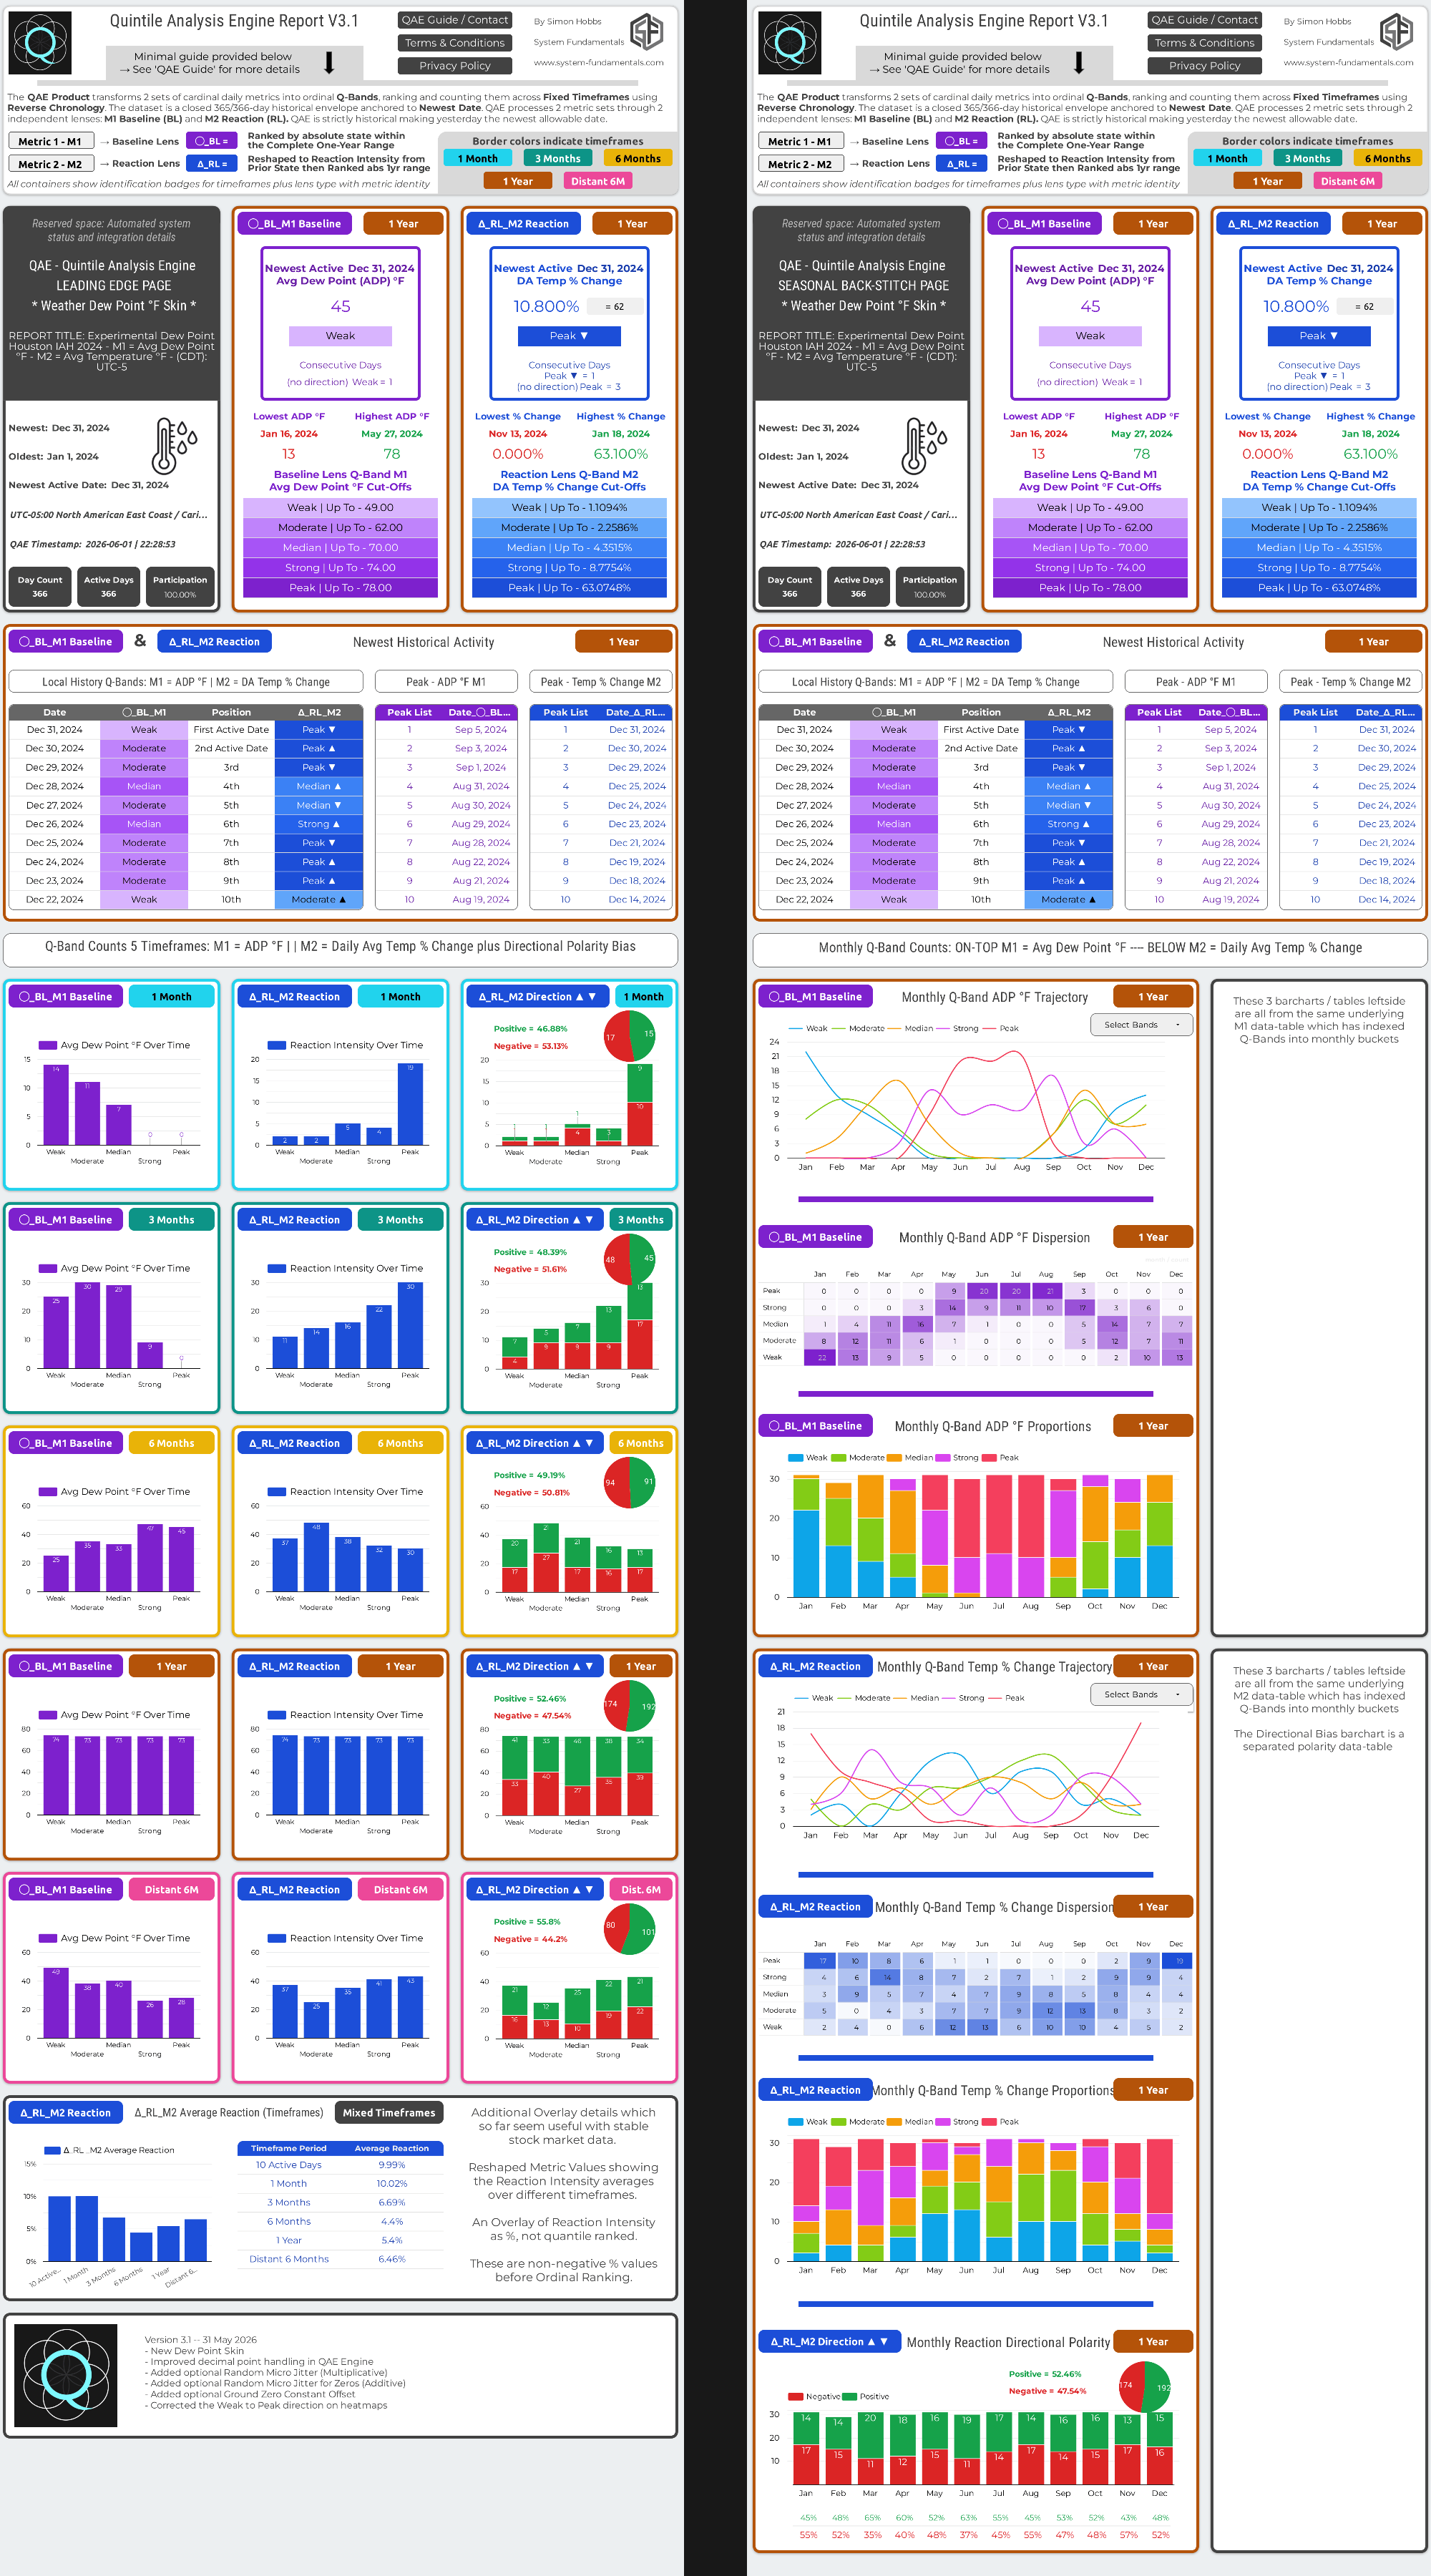 🔗 Download 2 Page QAE Report PDF . The Houston IAH Dew Point Skin QAE Report is derived from free public NOAA data delivered csv in Degrees Fahrenheit for M1 and M2. There are several reasons for this demo:
|
Status: Using QAE V3.1. This block requires more text content
Wind Experiment London NW3 2025 - QAE ReportAn experiment to see if the daily average wind speed as a M1-BL and max gust M2-RL establishes useful patterns with the current metric pairing relationship. This demo will showcase the optional Ground Zero Constant Offset as the Reaction Lens Peak Cutoff is quite high on this dataset Also, like Houston dew point dataset this was low resolution and required micro jitter to rebalance the Q-Band distribution |
Wind Experiment London NW3 2025 - QAE Report . • Click Image Below to Enlarge Wireframe Summary 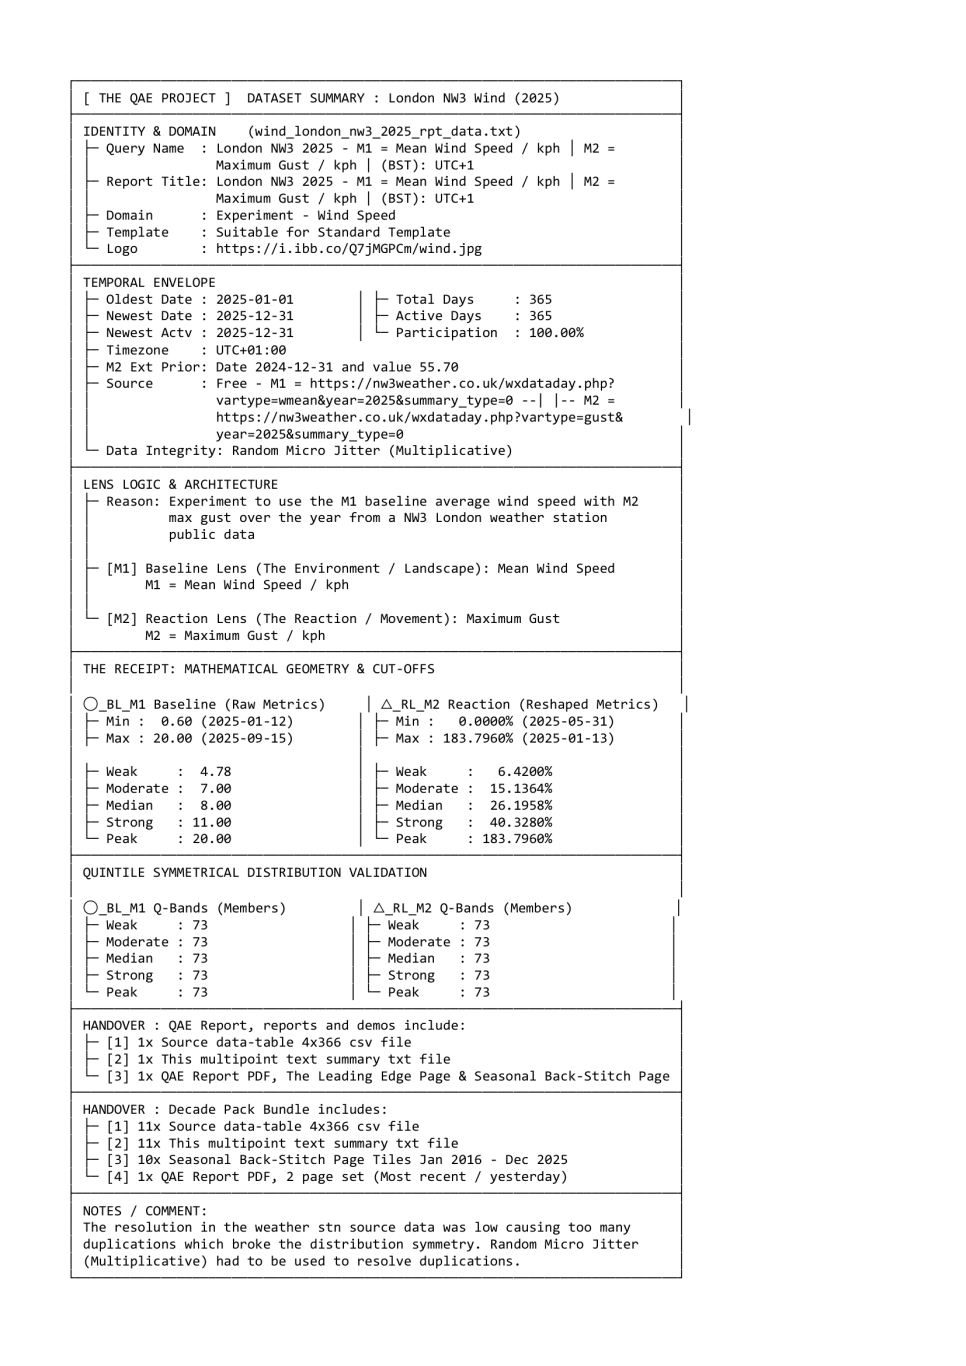 🔗 Right click to download: Data-Tables / Wireframe txt File . • Click Image Below to Enlarge QAE Report 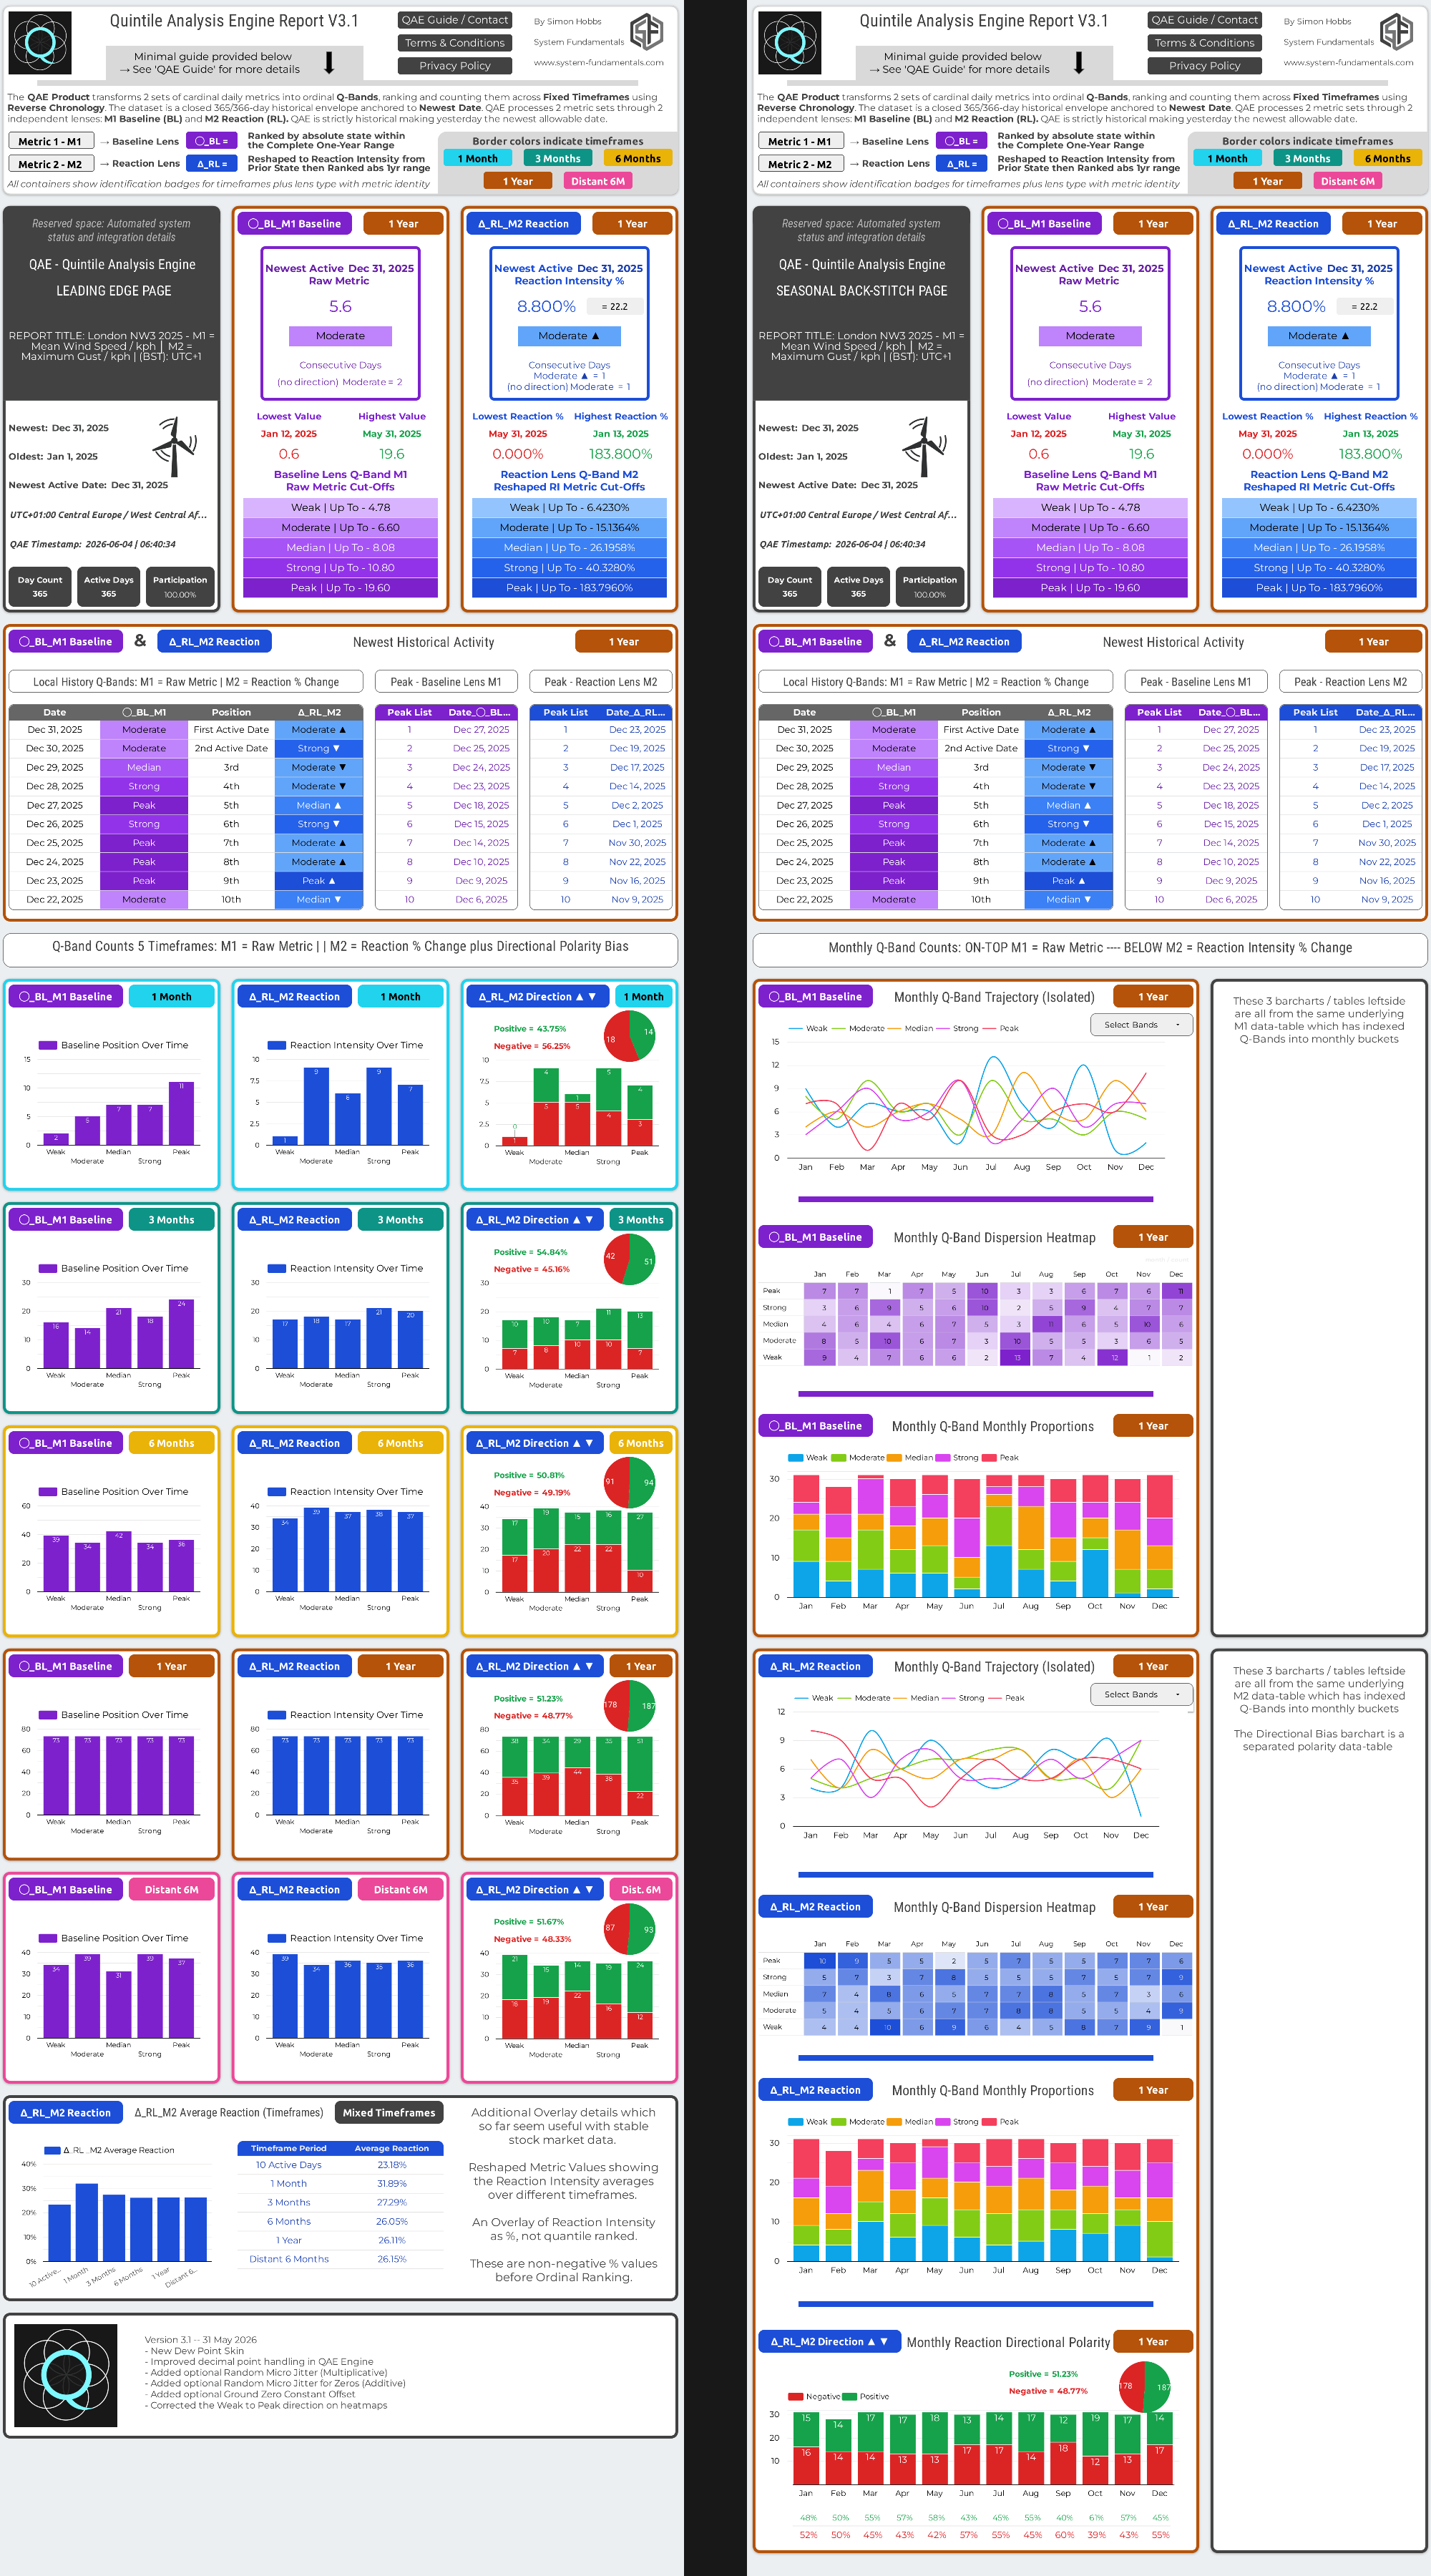 🔗 Download 2 Page QAE Report PDF |
Status: Using QAE V3.1
VIX - An Edge Case Anomaly. Point 2 — The Flat Spot: VIX spends extended periods compressed between approximately 15 and 20 — a healthy volatility regime. This produces a dense band of near-identical cardinal values in the middle of the range, partially defeating the purpose of ordinal differentiation. The interesting structural information in VIX lives at the extremes — the fear spikes and the floor — not in the middle where most observations sit. Volume and wind speed distribute across their full ranges with natural variation, giving ordinal ranking genuine structural separation throughout. Point 3 — Derived Not Observed: Volume and wind speed are direct physical observations of real events — a share changed hands, air moved at a measurable speed. VIX is calculated from options bid/ask midpoints — 30-day forward-looking sentiment prices approximating expected future volatility, not recordings of events that actually occurred. The cardinal input is one step removed from physical reality before it even enters QAE. Point 4 — Structural Asymmetry: The K₀ term in the CBOE formula treats puts and calls identically across all strikes despite their structurally different implied volatilities at different strike distances. Combined with discrete strike approximation errors that accumulate during extreme market stress, this creates a built-in asymmetric calculation — VIX spikes fast and decays slow — which is structural not incidental, making it a property of VIX data. |
VIX May 2026 - QAE Report . • Click Image Below to Enlarge Wireframe Summary 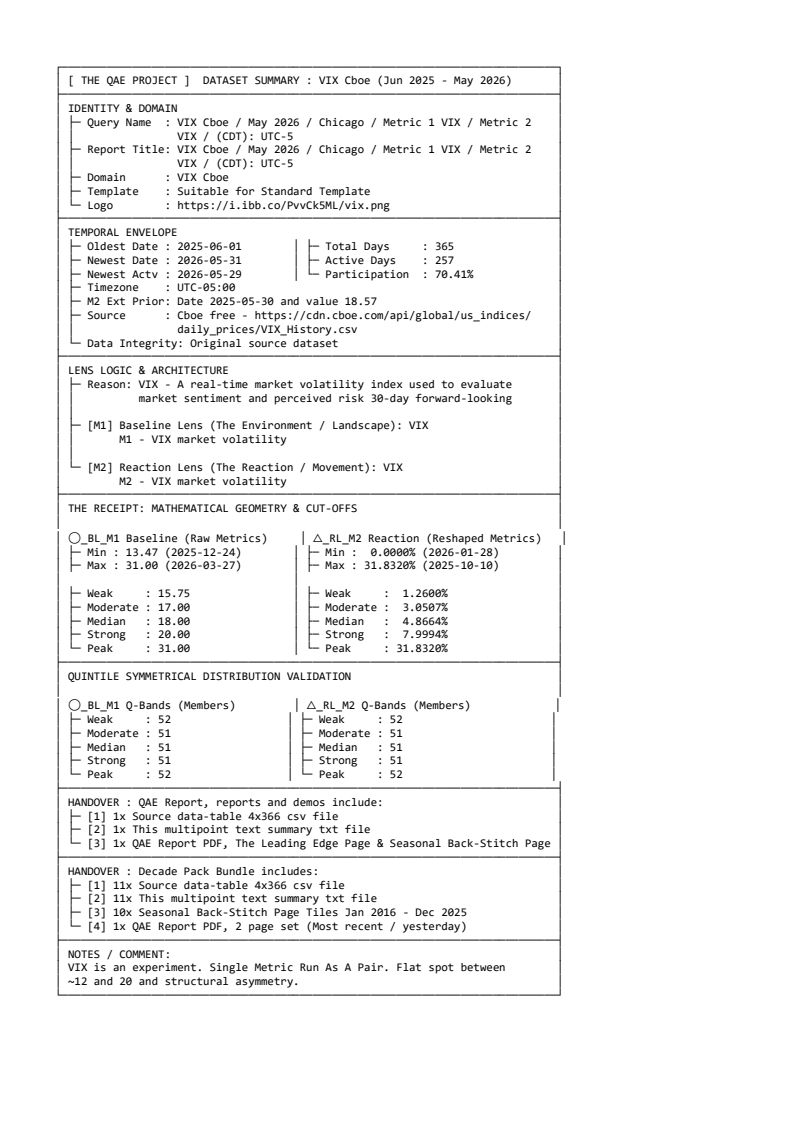 🔗 Right click to download: Data-Tables / Wireframe txt File . • Click Image Below to Enlarge QAE Report 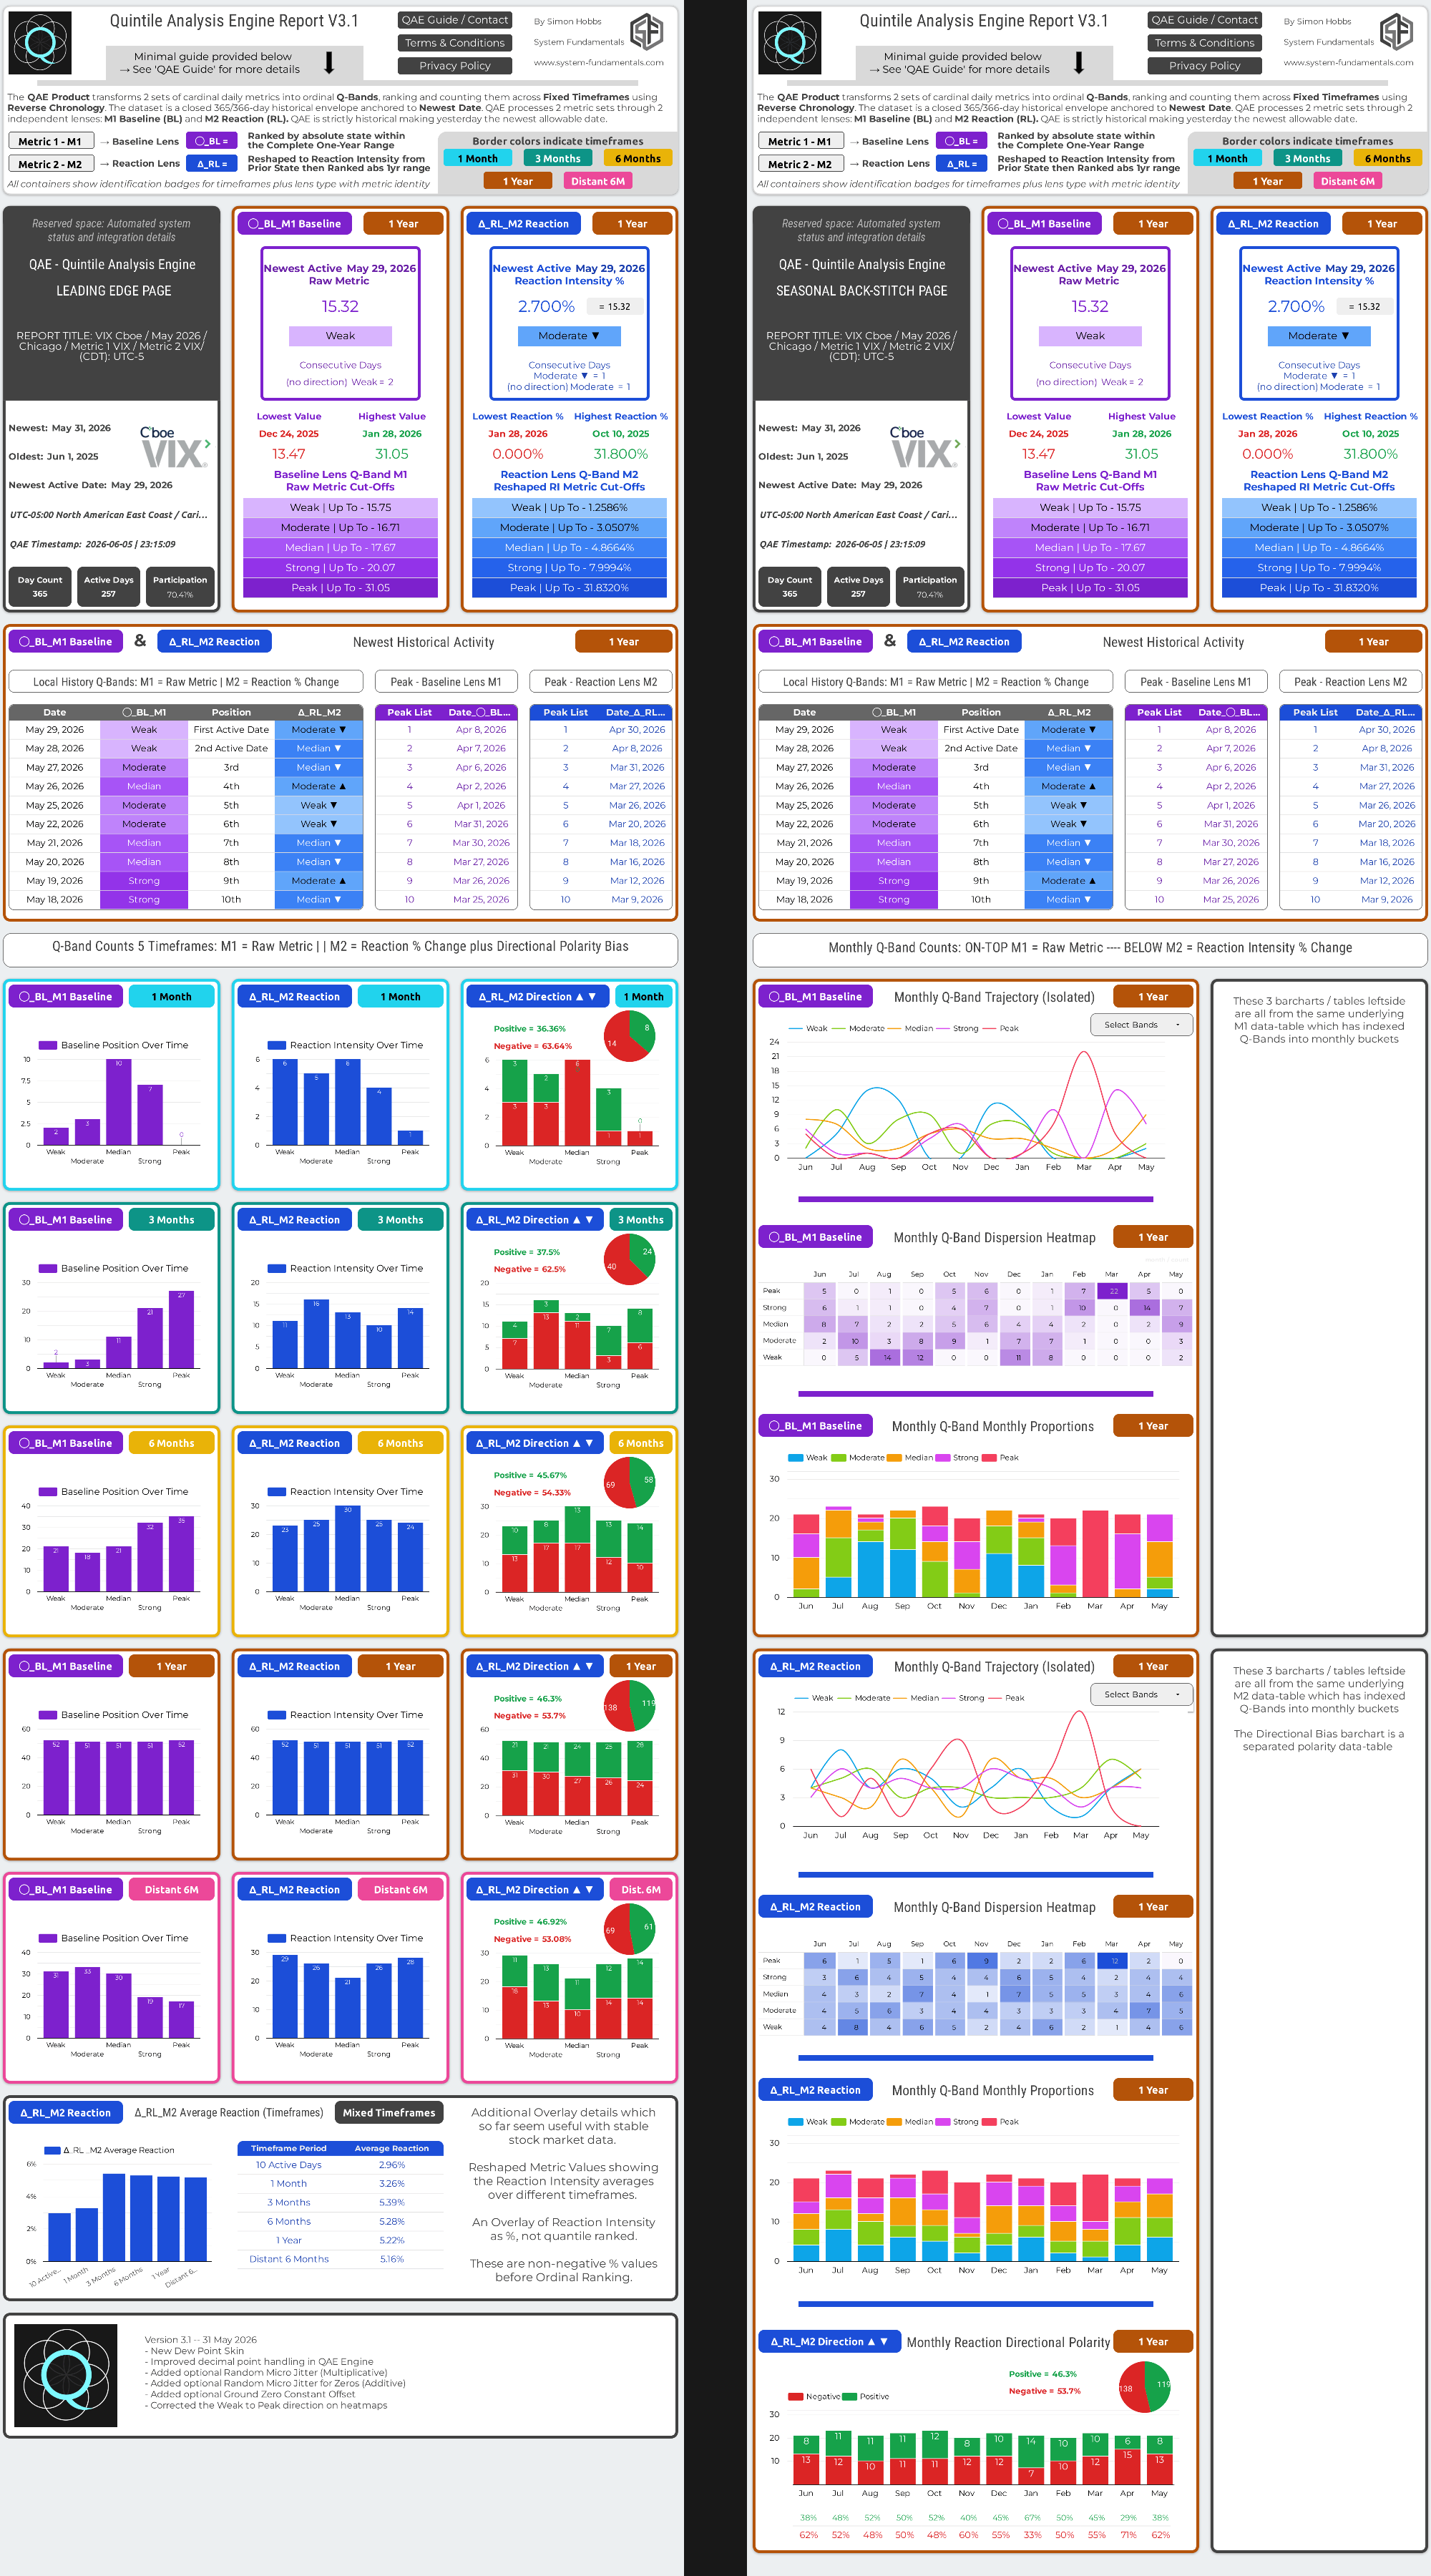 🔗 Download 2 Page QAE Report PDF |
Status: Using QAE V3.2
Demo 2: The Decade Pack – NVDA Data | Stock Market Skin
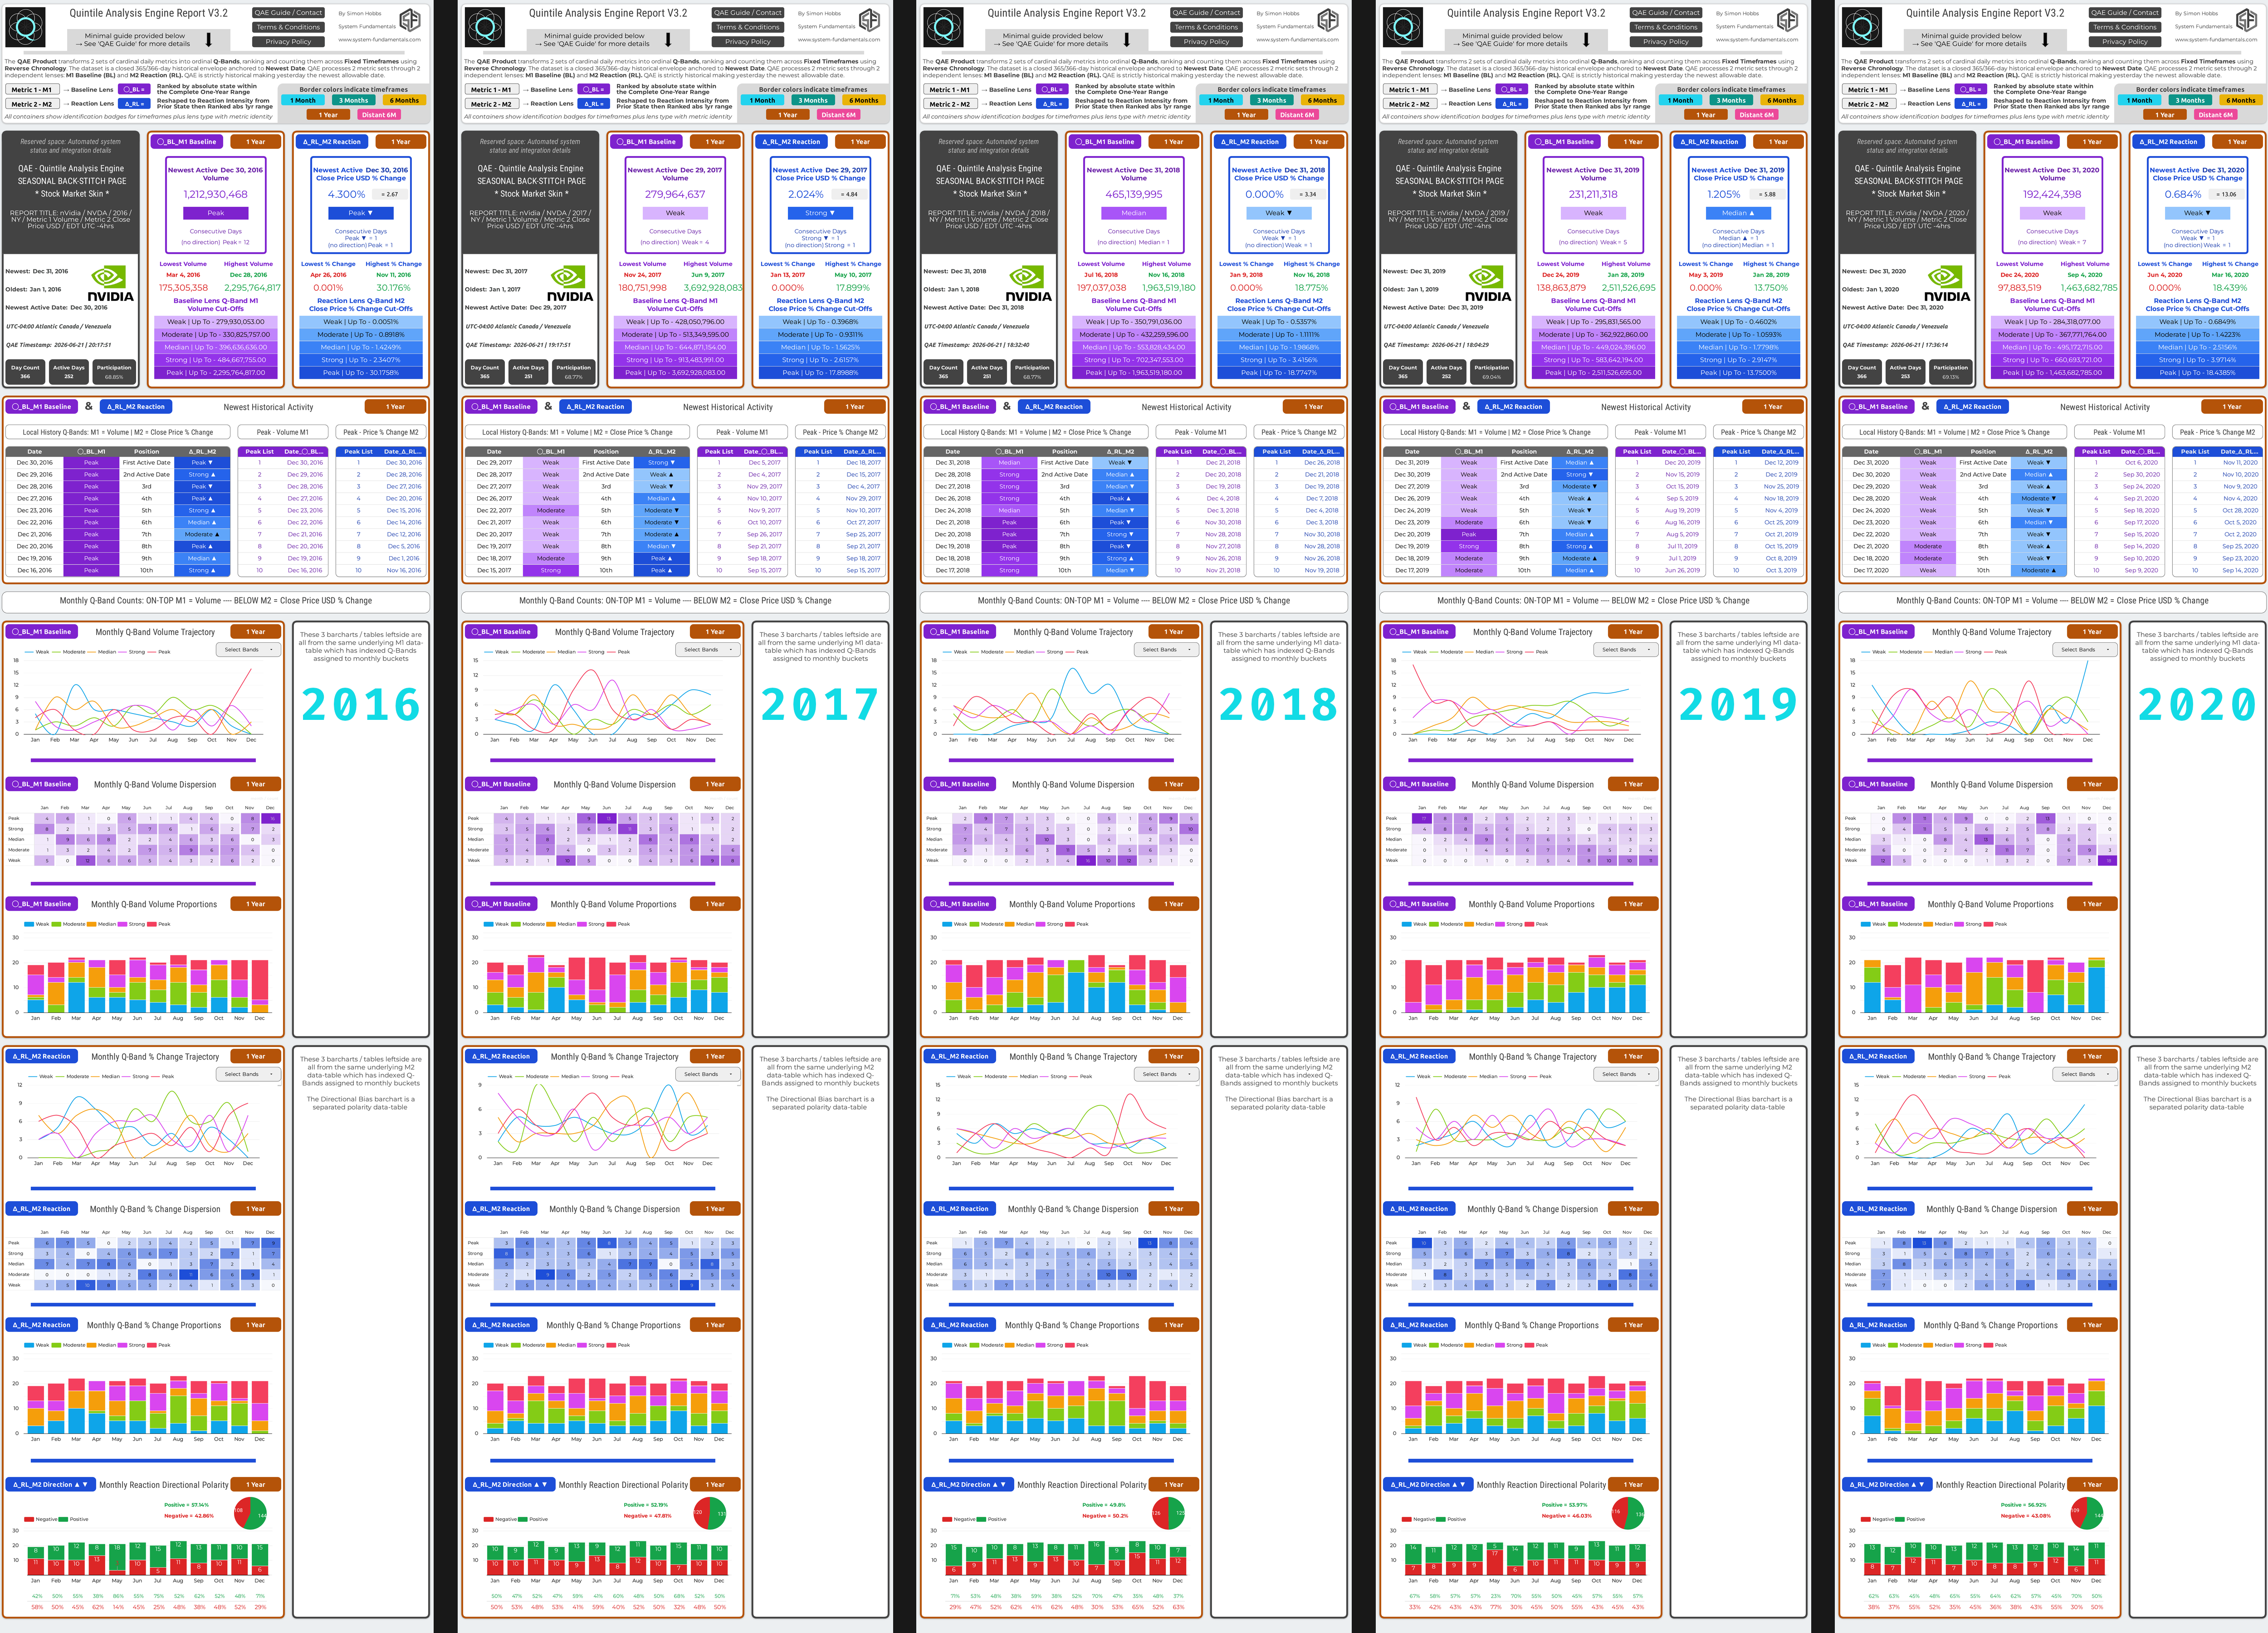
View NVDA macro historical distribution and seasonal behavior over 10 years with the QAE Decade Pack.
Note on Dataset Resolution: The oldest 2016 NVDA dataset reveals a natural boundary in market data resolution. When a stock remains below $3.00 for most of the year, the fixed $0.01 minimum tick becomes a significant fraction of the share price (a tick-to-price ratio of roughly 0.40%). Any daily move smaller than that threshold is invisible to the tape, causing a compression of 54 unchanged closes which breaks the required symmetrical Q-Band distribution. This was corrected using a randomized micro-jitter applied to the 2016 Metric 2 (Reaction Lens) and is the only minor dataset tweak within this entire 10-year demo.
Decade Pack Downloads & Details
- Click the red links, left-click will open files in a new tab or right-click to download
- Click Decade Pack Block 1 Image NVDA Jan 2016 – Dec 2020 (opens in new tab at 3600px tall)
- Click Decade Pack Block 2 Image NVDA Jan 2021 – Dec 2025 (opens in new tab at 3600px tall)
Complete QAE Decade Pack NVDA Jan 2016—Dec 2025
Contains all 10 Back-Stitch Pages as a single continuous 10-page PDF file
Tip: Drop this document into pdf2png.com for free to extract 10 very large 1-year HD image tiles for local printing or presentations
Free Daily QAE Report – NVDA
A daily updated QAE Report utilizing the NVDA dataset from MarketWatch to capture the most recent historical activity. This report focuses mostly on the Leading Edge Page to provide near-term historical context and operational insight, bypassing the historical back-stitching and monthly indexing used for historical macro analysis. Includes a rolling daily archive of reports beginning June 29, 2026.
- This section will be updated at least once per week as QAE Project Lite webpage is finalized. For now, please use the weekly updated archive on the right side.
- This is a downloadable rolling archive of Daily NVDA QAE Reports, complete with raw input datasets and report PDFs.
- For high resolution PNG images, convert the PDF using pdf2png.com or similar.
- The daily indexing applied here breaks the structural symmetry of the Monthly Indexing required to build QAE Decade Packs.
- Wish to test the QAE system and form an opinion? Here is one method: Input the main QAE website, selected report images, and raw datasets into a top-tier LLM (such as Gemini Pro, Claude, or ChatGPT). Once the AI is grounded, instruct it to reverse-engineer any sections of the visual report back to source data or real-world events
Follow NVDA activity daily also on X: @qaeproject
Free Daily QAE Report – NVDA
Status: Using QAE V3.2
2 July, 2026 | Stock Market Skin
Daily Report Archives
.
| 2026-06-29 | NVDA Input Data TXT | QAE Report PDF |
| 2026-06-30 | NVDA Input Data TXT | QAE Report PDF |
| 2026-07-01 | NVDA Input Data TXT | QAE Report PDF |
| 2026-07-02 | NVDA Input Data TXT | QAE Report PDF |
| 2026-07-03 | NVDA Input Data TXT | QAE Report PDF |
QAE Project Beta Statement
Statement & Core Disclaimers
Free Tech Demo: The QAE Project is currently an early-access beta operating as a free technical demonstration and documentation hub. Commercial purchases will only be available when Decade Pack availability is announced via this website.
The “Historical Calculator” Reality: QAE is a deterministic, domain-agnostic inspection instrument, not a predictive AI. It processes numbers similarly to a calculator, does not understand physics or recognize industries, and cannot provide financial, investment, or trading advice.
The 4-Layer Liability Split: The QAE Engine is solely responsible for deterministic Computation (Layer B) and Visual Rendering (Layer C). The machine’s mechanical responsibility strictly terminates at the QAE Report Handover. Assigning meaning to the geometric output and dealing with any real-world consequences are exclusively User Interpretation Responsibilities at Layer D.
Open Call: Seeking 3 Beta License Partners
As the QAE products move through beta launch, the project is actively seeking 3 experienced community operators, analysts, or group admins to become early B2B white-label revenue split license partners. For those managing a network of “Pattern Investigators,” this is an opportunity to partner directly at the seed level. The goal is to form a collaborative, self-managing team to help distribute and shape QAE products.
Rather than simply reselling, these 3 partners will actively help mold QAE to real market needs. Market knowledge and practical awareness will be required to select the final QAE Decade Packs, advise on templates and skins, and assist in translating the website text into smooth, user-friendly documentation. Operators are encouraged to reach out via email to engage with an initial draft framework.
Quintile Analysis Engine

Contact QAE Project
Please use the email or form to contact the QAE Project with any opinions, concerns or requests during beta phase
System-Fundamentals.com


web: qae.system-fundamentals.com
email: qae@system-fundamentals.com
QAE PROJECT LEGAL COMPLIANCE
Please click the accordion below to expand
—
This accordion has 2 parts — this section is a structural requirement. Legal content is in the next accordion container
QAE Project: Terms & Conditions | Privacy Policy
Terms & ConditionsQAE Project: Products, Website and
|
Privacy PolicyQAE Project: Products, Website and
|
Copyright 2026 Simon Hobbs – QAE Project (qae.system-fundamentals.com | System-Fundamentals.com)